-
tvOS AppにおけるWebインスペクターの使用
Webインスペクタを使用すると、tvOSを含め、複数のAppleプラットフォームでのWebコンテンツをデバッグできます。このビデオでは、Webインスペクタの強力なデバッグ機能を紹介し、tvOS AppのTVMLコンテンツのデバッグを加速させるべくデザインされた機能について解説します。
リソース
関連ビデオ
Tech Talks
-
このビデオを検索
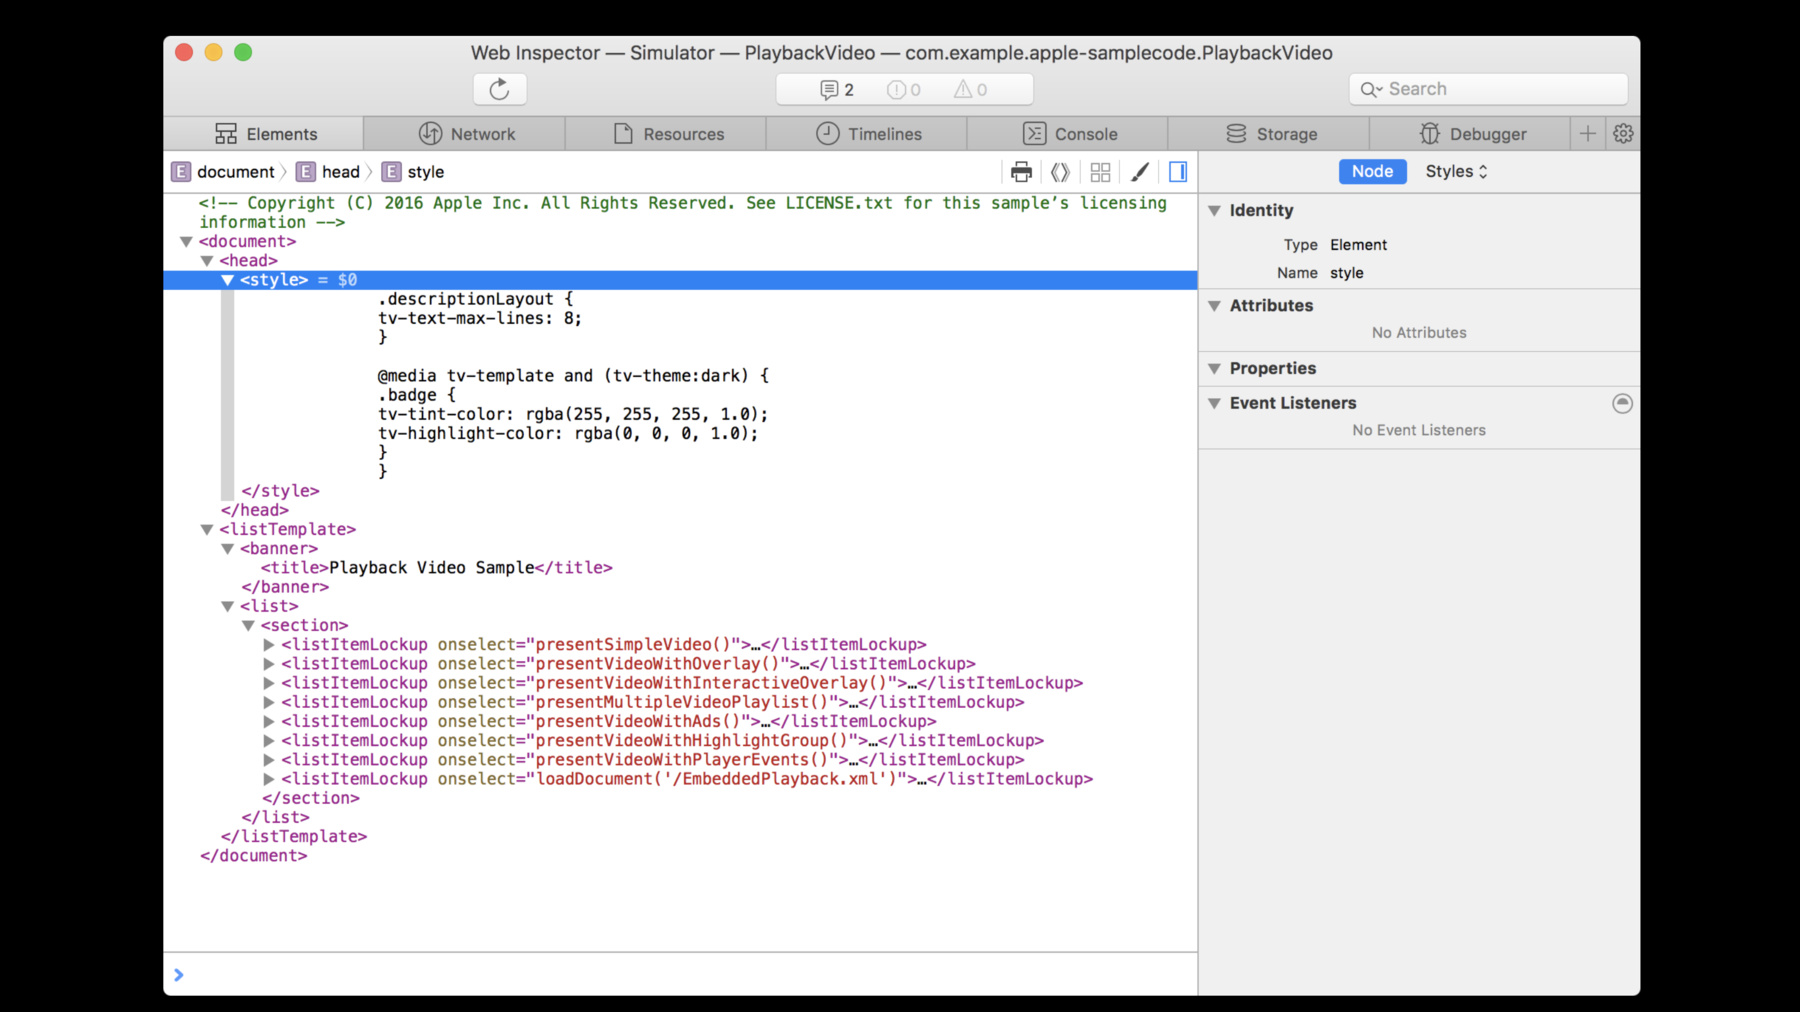
Here are some features in Web Inspector that will help you to debug tvOS apps. Let's get started. To demonstrate these features, we'll open up an example app for video playback from our Sample Code Library. Currently this app is running in the Xcode Simulator. To access Web Inspector for an Apple TV device or for an Apple TV Simulator, click on the option in the Develop menu. Once inside, you can use seven of Web Inspector's tabs. Elements, Network, Resources, Timelines, Console, Storage, and Debugger. The Elements tab shows you the TVML DOM structure. Here you can edit and copy TVML, move and delete Nodes, and add Attributes. To see more Node properties and Event Listeners, see the Node section in the right sidebar. Option-click to copy the path of a selected Node. You can also view computed styles and modify style rules in the Styles section of the sidebar. Rules that have media queries are shown with media query information. Default TVMLKit styles are shown as the User Agent Stylesheet and are locked. These styles cannot be modified. In the Network tab, you can see all the resources loaded by the current app. In addition to the default tab features, there is a button to clear network items. You can also inspect timing information, examine Request & Response headers, and see the response result. Next is the Resources tab. If you include structured comments in your app's JavaScript files, those files will show up in Resources for further examination. The Timelines tab helps you check the performance of your app. Here we have a prerecorded example in the Timelines tab. Select your instruments and record events like a reload operation with the record timeline button. For more details, click on one of the instruments you recorded, JavaScript & Events or JavaScript Allocations. To clear your timeline, click the clear timeline button.
Next is the Console. Besides showing messages logged by the app, this tab has features to filter the console log, clear the console log, and trigger garbage collection. The Storage tab shows a persistent state that is available to web content being inspected, which can be refreshed. By default it shows Cookies, Local Storage, and Session Storage. But as available, this tab also shows additional storage APIs, like WebSQL, IndexedDB, and Application Cache. You can add and modify any of the key value pairs displayed in this tab. Last is the Debugger, which, like the Network tab, also shows a list of resources, and has default tab features. It also has a Breakpoint section in the left sidebar, and a Scope Chain in the right sidebar. The Debugger controls to pause, play, and step through your code are in the top left corner of the tab. In summary, you can access Web Inspector for tvOS apps through the Develop menu in Safari. Use Web Inspector to examine your content in tvOS. To try the latest version of Web Inspector, download the Safari Technology Preview from the Apple Developer site. If you find bugs, report them at bugreport.apple.com. For more information and additional resources about Web Inspector and tvOS, use the links in the Resources section associated with this video. And that's your quick walkthrough of debugging tvOS apps with Web Inspector. Thanks for watching.
-