-
Advanced Debugging and the Address Sanitizer
Discover UI debugging and how to use advanced breakpoint actions to quickly explore and fix your app. Learn how the new Address Sanitizer feature finds buffer overflows, use-after-free errors, and other memory corruption bugs at run time.
Resources
-
Search this video…
MIKE SWINGLER: Good morning.
Welcome to Advanced Debugging and the Address Sanitizer. I'm Mike and So how are we all doing? Good? Ready? Excited? All right. Let's get going. So I will start off and cover some neat new features that we added to Xcode and also show you some old tips and some new tricks that you might not know about. We will begin with the view debugger and see how you can get even more insight -- even more insight into your app's UI and its user interface elements, and how they behave at runtime. We are going to debug an AutoLayout Constraints problem, which, at least for me, I could always use a little help understanding exactly what AutoLayout is doing at runtime.
Next, we will dive into debugging your code with Advanced Breakpoints. I will show you how you can set custom actions and conditions to quickly diagnose exceptions, and conditionally print values all without cluttering up your code with NSLogs or prints.
And after that, my colleague Anna is going to come up and show us the newest, most exciting debugging feature we've added to Xcodes' debugging toolbox, the Address Sanitizer.
She will do a deep dive into how it works, and what kinds of bugs it captures, and how you can start using it to start scrubbing your code today. So for these first two topics, I thought I would just start off and jump right over to the demo machine, and show you.
So here we have an application called Jogr.
It's a fitness application that allows you to time your runs, track the routes that you take, and tag photos along the way. We have used Jogr as a demo app for a few years now and this year we've added some new features using Swift, and converted some of the classes from Objective-C. It's very much a hybrid application.
It also now uses size classes in its storyboard, and has fully adopted AutoLayout.
So, since we changed and added all this new code this year, it's a pretty good bet that we've added a few bugs. So let's find them.
I'm going to start off just by clicking on the timer here, and well, the first problem that's pretty obvious is that our ring around our timer is getting clipped. This was not how it was in the original artwork that I had provided.
So this might have something to do with the fact that I'm running Jogr on an iPhone 5 screen size. As I was developing this on the iPhone 6, I probably did not fully test, to see that the layout was fully adaptable down to smaller screen sizes. To help get a little insight into what's going on here, I will click on the Debug View Hierarchy button down here in the Debug bar.
Right now, a snapshot is getting taken of all of my views and loaded into Xcode along with a bunch of runtime information about how those views interact.
As I click and drag around the canvas, you can see how I can twist the scene to show all of the different views, and how they are layered on top of each other. I can even click on a specific view to select it, and we can see all sorts of details about it over here in the object inspector.
Now, there's a lot of stuff going on here, and with this navigation bar and the background and all of that, and I really just want to focus on the one thing that you care about, which is the content that I put in the center.
So you can do that just by double-clicking on the view. Just in case you missed that, I will show you how to unfocus, which is just double-clicking on the canvas and here we can go again, and we can just focus on this one. You will also notice that over here, in the Debug Navigator, all of the hierarchy above the UI stack view has been elided away, since we are currently focused on the UI stack view.
If I click on the image that is getting clipped here, I can inspect its balance and constraints with the size inspector here.
The size inspector doesn't just show me the x, y, and Rect coordinates of this, it also shows me the constraints that are affecting this view at runtime. The constraints that are not actually in play right now, that are affecting the size, or the bounds, or the x and the y, are shown down here in gray.
So this is actually a little odd. I see that the self height constraint of 249 points, which is the actual content size of this image, is not actually in play at runtime. If I look up to the constraint that says the superview should be the same size as the image, we see that it is in play. It's like something else is constraining the size of superview. So let's walk up the view hierarchy and see what's going on with that superview.
So here, we see that there is a three-fourths or a .75 relationship to this other view, and I know that that other view is the one that contains my start button down below.
We can see all the same constraints over in the debug navigator as well, and we can open them up like this. We see that we have the same three-fourths constraint on the view that contains the button, and everything here looks normal. The top and the bottom relationships are sensical, top is higher than bottom, bottom is connected to the superviews bottom, and nothing else. So why don't we walk up the view hierarchy one more level. And we can see here that there is something a little bit odd. We have a center y-constraint that is trying to keep the entire stack view centered vertically in its container, but we also have this self-top connected to the superview top by 50 points. And that's kind of odd. So I don't think that 50-point constraint should actually be there. I think it probably was added when I was initially switching this view over to size classes, and I told IB to just add all the missing constraints, and then later I set up the vertical centering, and I probably forgot to remove it. Let's change this over here on our storyboard and see if that's the issue.
So I can select the stack view and there it is. That's our 50-point constraint. I will just delete that.
And rerun. And great! Now our circle goes all the way around. Nothing is clipped, and this view is fully adaptable.
So let's try running the timer.
Okay. Looks like I got a crash. I'm going to switch the Debug Navigator here to view the crashing thread, and that's not really all that helpful. It has crashed in main. If I pull up here on the console, I can see that, well, this was some sort of exception that was thrown, but this is not as helpful to me right now, because I want to actually stop the program and be able to debug it at the moment that the exception is thrown.
In order to do that, I can go to the Breakpoint Navigator and click down here on the plus to add an exception breakpoint, and I'm going to configure this breakpoint to stop on just Objective-C exceptions. Like that.
And we can just re-run the application. And hopefully we'll just catch the problem right at the moment that it occurred.
So this is great, but if I look at my console now, I don't see anything. There's no message to describe exactly what the exception is. So I'm going to use a trick that I learned from my friends on the LLVM team, I'm going to navigate to the Ob-C Exception Throw function, inside the Ob-C runtime. I will print the first argument of that function, which is actually the exception object itself. I do that by saying print object, arg1, and this is the actual exception message itself.
So this is so helpful that I'm going to actually modify our exception breakpoint to just do this all the time, for any exception that we hit. I can add an action here and I'm going to just type the exact same thing that I typed into the console. Print object arg1.
Now if I rerun the application, run the timer, now I'm still stopped at the exact moment that the exception was thrown. I actually have the exception message itself in the console, and so here now when I look at the line that this exception is being thrown from, I can see that I'm constructing a range, and the range is out of bounds, and I bet it's probably because we are starting at index one instead of index zero, and going for the full length of the string when we are setting the font attribute.
So let's rerun this again and see, alright, so it looks like our timer works correctly here.
So, now we've successfully found two bugs. Let's go for a third.
So I'm now going to try taking a look at a route that I ran this morning, before I came here.
And, that looks about right, but if we go back again, well, that really doesn't look right at all, I didn't start off at Mosconi, and run down the Embarcadero, and jump in the water, that's kind of silly. Let's try that again, And, alright, now I just hit a crash, so, I don't know, this seems like a, definitely a problem with our data model here. So I want to figure out what we are doing when we are making the overlay of points that we put on to the map.
So here, I'm going to go to the class that we know makes the route path overlay. And this is where we actually take a bunch of data points, and pull them out of a dictionary, and create and construct a poly line that represents the route that I ran. So here I'm going to set a breakpoint and see what sort of data values we get.
I'm going to open up the Debug Console and look at the variables view, and down here, we can see the point that I'm interested in. It has these values. I will just kind of step forward and, well, this is interesting, but kind of tedious. All the values kind of look similar. What I will do here to make this faster, and just to see all the values together, is I will edit this breakpoint. I will print the point Struct that I'm actually inspecting here in the variables view. And then I will say, automatically continue after evaluating action. Actually, this is not a condition. This is an action. There we go.
And let's just continue running this.
And we can see that all of our points look relatively the same, but there's still that one that's teleporting off into the middle of nowhere.
But all the values still look, you know, reasonable. I'm not exactly sure what the problem is here. We might have to get some more help from someone else. So, let's switch back to the sides. So just to recap what we saw, first we started off by digging into a constraint problem on the timer view of Jogr. I showed you how you can now double-click on a view to focus on a specific component. We inspected some of the constraints and found that just one of them needed to be removed when we ran into another screen size.
Next, we hit an exception running the timer, and used the exception breakpoint to stop at the exact moment of the crash, and also print the exception message. And finally, we were able to add a print and continue breakpoint that added logging, all without cluttering up our code with NSLogs or print statements.
Now to help solve the next mystery of why we are getting such odd results from the run that I did this morning, I would like to introduce Anna.
ANNA ZAKS: Thank you, Mike. Hello. Let's go back to that route that Mike showed last in his demo. As we were testing this demo app, you saw all of these routes and more, including the correct one.
We were really hoping Mike would not run into the correct one again and again while on stage, because it would be not so good for our presentation. This unpredictable behavior is often caused by memory corruptions, for example, memory allocated for one object might be overwritten by another object.
Or maybe you are using memory that does not belong to you due to some miscalculation. I'm sure a lot of you have seen something similar to this before, as well. A random crash happening somewhere in our code. Maybe you see this every single time you test a certain aspect of your app or maybe you only see this on Friday evenings when you are really ready to go home! The worst case scenario is when your users see these instabilities or random crashes, and you can't even produce them locally. Memory corruptions are known to be notoriously hard to consistently reproduce and finding the root cause of the misbehavior is often a difficult task.
So what can be done? Best way to minimize your exposure to memory errors, is to avoid memory manipulations altogether. For example, using language occurrences such as Swift and automated reference counting will take you a long way.
Even though the memory corruptions are still technically possible there, writing code that causes them, will be much less likely.
On the other hand, if you have code that manipulates memory directly, by calling malloc, or by doing arithmetic, or you simply have code that interoperates with C and C++ APIs, you are in the risk group that needs the most help.
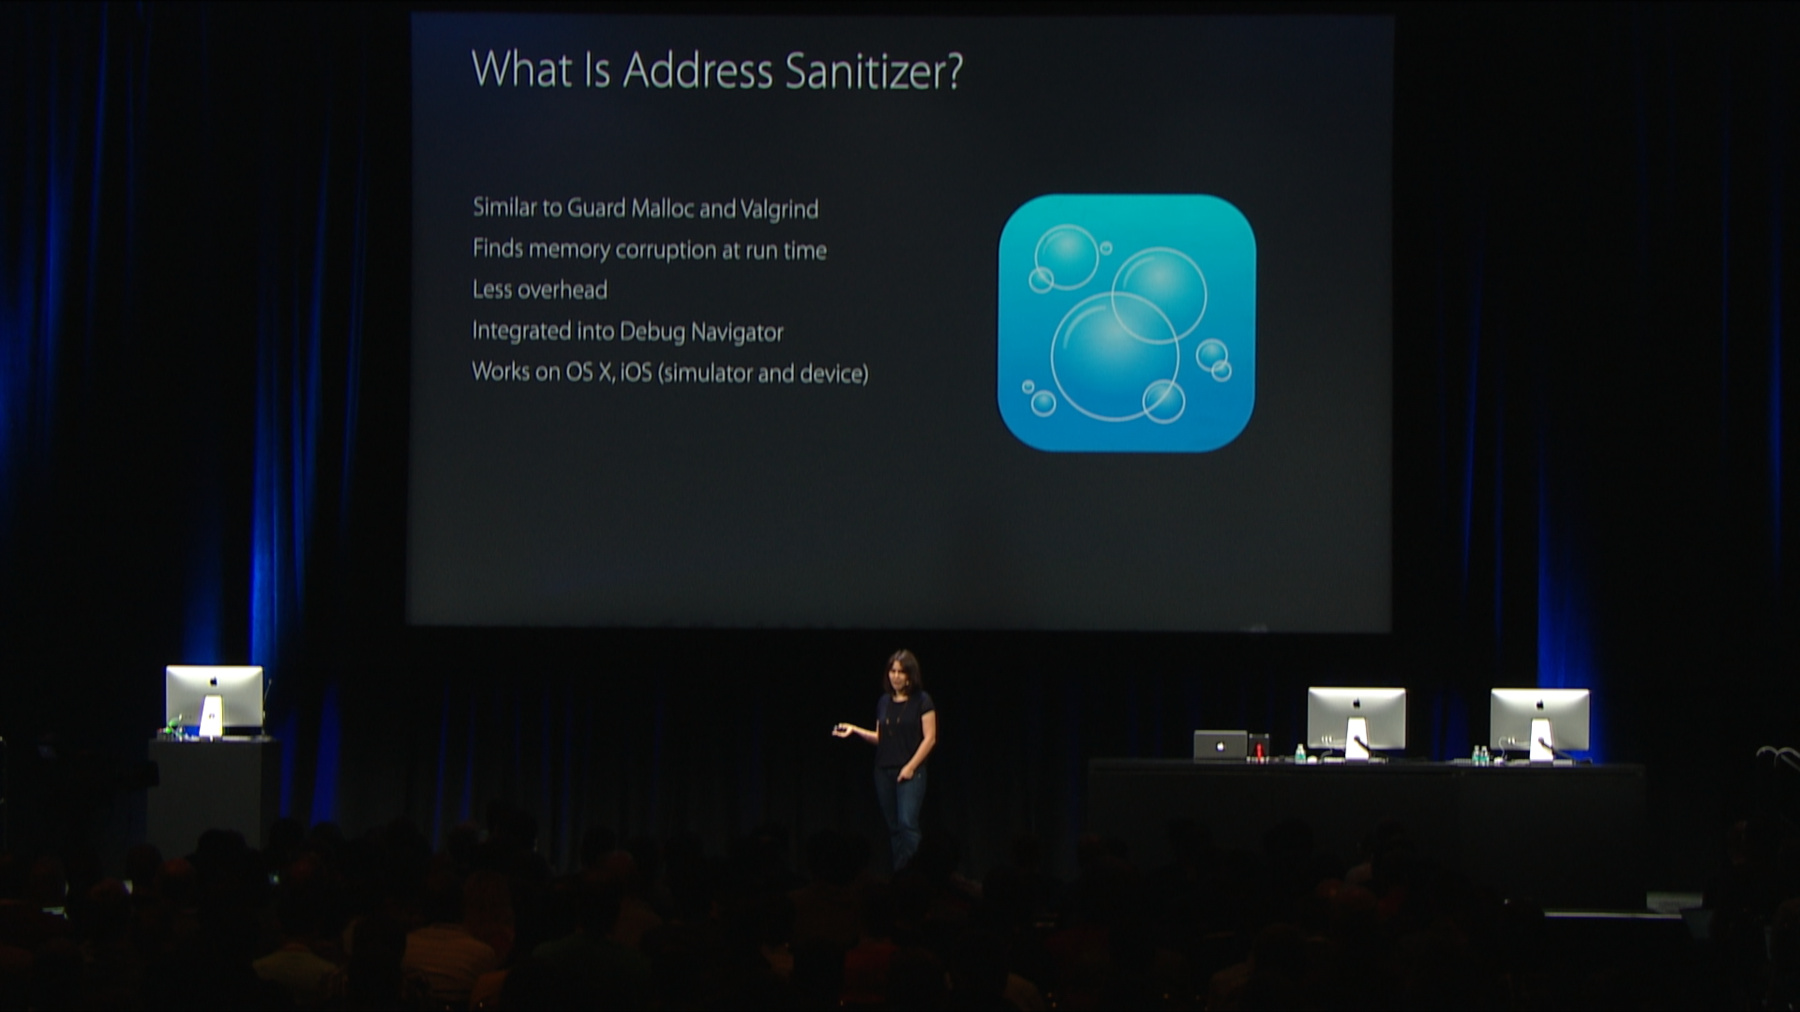
Address Sanitizer is an LLVM tool for C-based languages, that serves the same purpose as Guard Malloc, as it finds memory errors at runtime, however, it has a lot of benefits over the other tools. It has much less runtime overhead and it also produces comprehensive, detailed diagnostics that are integrated directly into the Xcode UI. What's also very important is that it is the only such tool that works on iOS devices. Here's a list of common errors that Address Sanitizer can catch for you.
For example, it's very good at catching buffer overflows, which is a very common error to make, that is notorious for its relation to security exploits. As you can see it finds some of the tools that are -- some of the errors that are found by Valgrind and Guard Malloc, however it also finds new categories of bugs, that the other tools do not focus on.
Let's go back to the demo and see how you can turn this on in your project.
So I will start right at the place where Mike left off and let's see if the Address Sanitizer will help us diagnose this routes issue.
In order to turn Address Sanitizer , you go to Edit Scheme. Go to the Diagnostics tab.
And check Enable Address Sanitizer.
Unlike the other memory management tools, Address Sanitizer requires re-compilation. So after this check box is checked, Xcode will know to rebuild your application with Address Sanitizer turned on, and it will launch it in a special mode that will allow Address Sanitizer to poke at your process even more at runtime. Let's go ahead, rebuild and re-run this app.
And see what happens when we go to the route, to see the route. Now, what you see here is Address Sanitizer has spotted an issue, and its diagnostics are integrated directly into the Xcode Debugger UI.
What happens is very similar to what will occur on a crash, however, unlike the case with a Sec fold, you get much better diagnostics.
Here, it tells us that the heap buffer overflow has been detected, and you also see the stack trace, at which this memory fault has occurred. As you can see, we are calling it Poly Line With Points and common method of Map Kit. We are testing at the buffer, and the number of points, which is calculated by taking the length of the buffer and dividing it by the size of each point.
That looks okay. As your application is being executed under Address Sanitizer, it collects important information about the heap objects in your process. For example, allocation, heap allocation, and deallocation events.
And when it finds this memory fault, it uses heuristics to relate the faulty address to a valid object in your heap. And that information is presented here under the memory item. So here it tells us that the faulty address is one byte after 2,240-byte heap region, and it also tells us where that heap region has been allocated.
Even though this is not a live thread, but a historical snapshot of the process execution when that allocation event occurred, we can look at streams as if it was a live thread, and here it takes us right to the point where the memory has been allocated.
Okay. So let's see, the size of the buffer is calculated by taking the size of each point and multiplying it by number of points and we use MK Map Point to, as our points representation. It's a Struct with two doubles.
So what is the problem here? Let's go back to the Use site.
Well, the type you pass the size of here, is different. We pass MK Map Point star.
But we know that we have just allocated a buffer of Structs, not a buffer of pointers.
And since the size of each pointer is smaller than the size of our struct, that contained two doubles, the count we get here will be larger than the number of elements that our buffer contains. So that would explain why we get all of those extra points on the map. To fix this problem, we just need to remove the star. And as you see, this is like a very common mistake that people could make and it would be very hard to find this by just looking at this code. Now, in this case, this information alone is sufficient to diagnose and fix the problem. However, you can -- if you feel like you want to poke at this report even more, you can go to the Memory View and see which memory is considered to be valid, and which memory is considered to be invalid, from Address Sanitizer's perspective. To go to the Memory View, you can click on the address here, and here you can see all the greyed-out stuff is invalid memory, and all the black memory is considered to be valid. Now let's go back and re-run our app, and see if removing the asterisk did, fix that problem.
Now, I'm going to go back to the Routes view, and aha, here is the path that Mike ran this morning, and the morning after the Bash, too. I'm impressed. So let's go back and switch to the slides.
So as you had seen, turning on Address Sanitizer is very easy. You go to Scheme Editor, open the Diagnostics tab, and check the Enable Address Sanitizer checkbox, then you just build and run your project.
And also as you have seen in the demo app, the overhead of using Address Sanitizer was not even noticeable. This low runtime overhead allows you to use Address Sanitizer, not only when you are debugging some memory corruption problem, but also while performing UI-driven testing, where you manually test different aspects of your app. Taking it one step further we recommend that you use Address Sanitizer in your continuous integration. Since it's a runtime bug-finding tool, it will only catch bugs in the code that has been executed. So you should provide it as much coverage as possible for best results.
To enable Address Sanitizer in your tasks in Xcode or in Xcode Server go to Edit Scheme, select Task, and then again go to the Diagnostics tab, and check the Enable Address Sanitizer checkbox, build and test your app. You can also enable it on command line, by passing an extra argument to Xcode Build. We recommend that you use Address Sanitizer in Debug builds, where the compiler optimizations are turned off.
However, it is also supported with the Fast optimization level that corresponds to 01 compiler flag.
One thing to keep in mind is that when you are deciding between those two optimization levels, is that your debugging experience will not be as smooth in case you have any compiling optimizations turned on.
So now we will go to the most exciting part of this talk. I will tell you the cool technology that powers this tool. So traditionally, Xcode compiles your source code using the clang compiler, which produces an executable binary.
In order to use Address Sanitizer, Xcode passes a special flag to clang. It produces an instrumented binary that contains more memory checks.
And at runtime, this binary links with asan runtime dylib, that contains even more checks, and that dylib is required by the instrumentation. But how does these memory checks work? Address Sanitizer checks all allocations in your process. If this is your process memory, Address Sanitizer maintains so-called shadow memory, that tracks each byte in your real memory, and it has information of whether that byte is address-accessible or not.
Bytes on invalid memory are called red zones or as we say, memory there is poisoned. When you compile your program with Address Sanitizer, it instruments every memory access and prefixes it with a check.
If the memory is poisoned, the Address Sanitizer will track the program and generate a diagnostics report. Otherwise, it will allow you to continue. Let's take a closer look. Assume p is a pointer, then IsPoisoned function checks the relevant byte in the shadow memory.
In this case, the memory is valid, so the program is allowed to write to that memory location. However, if it does not point to valid memory, the condition will be true, and the program will trap right there, where the invalid memory access was about to happen.
This is how Address Sanitizer produces reports, and reports this problem to the user. Now, the lookups into the shadow memory need to be very fast.
To achieve this, we maintain a lookup table where every 8 bytes of your memory are tracked by one byte in the shadow.
This is a very large lookup table. So we don't actually allocate it, instead, we reserve it when the process launches, and use it as needed.
With that, we can look up the address by simply taking the value of the original pointer, dividing it by 8, and adding a constant offset, which is the location of the shadow in the memory. Even if the byte of the computed address is nonzero, we know that the memory is poisoned. Now, let's talk a little bit about the heap.
To catch overflows and other bugs in heap, Address Sanitizer provides its custom allocator that replaces the default Malloc implementation.
The default allocator can organize objects in various ways. For example, it can lay out objects one after the other, which is great for optimizing a memory consumption. However, this is not so good for catching bugs because an overflow on one object will land on another object, and therefore, it will be indistinguishable from a valid memory access. So to fix this problem, ASan's allocator lays out objects further apart from each other, and all the unused memory in between those objects is marked as poisoned in the shadow. When an object is deallocated, we mark the object as poisoned in the shadow. To summarize, the custom Malloc implementation inserts poisoned red zones around the valid allocations, to catch heap underflows and overflows.
It delays the user-freed memory to make Address Sanitizer more effective at catching user-free and double-free errors.
And it also collects Sect traces for allocations and deallocations, that allow it to provide those comprehensive, detailed diagnostics that we have seen in our demo, and that could be the difference between understanding the problem immediately, or spending a lot of time debugging it and, you know, figuring out what happens. Now, let's talk about the stack. So similarly, to heap memory, red zones are put in between individual stack variables. So, suppose we have an array, and an integer as our local variables, then when compiling under Address Sanitizer, additional red zones are inserted in between those variables, so we can detect any overflows on stack variables.
Stack red zones are poisoned when you enter the function at runtime, and they are unpoisoned when you are exiting the function at runtime. Dealing with global variables is very similar, again, during compilation, the global variables are instrumented, and additional red zones are inserted around them. Now, both stack and global compiler instrumentation is a really useful feature of Address Sanitizer. This is what allows it to find those bugs that other tools cannot catch. Here is yet another type of a unique bug that Address Sanitizer finds, that is of special interest to those of you who are Avid C++ developers.
Here we have a C++ container vector, and even though all memory to v.begin, to v.begin plus capacity has been allocated, accessing memory past v.end is an error.
Leap C++ has been instrumented to provide more information to Address Sanitizer so that it can find errors such as this one.
As we had seen, all the checks that we have talked about required compiler instrumentation. However, we know that some errors could occur even -- could be triggered even in the code has not been recompiled, for example when we are calling memcpy function. Address Sanitizer uses a technique called BYOD function interposition to replace dozens of standard library functions with its own versions at runtime.
Since this is a running technique, those checks will trigger even on code that has not been recompiled.
Here's an example of a memcpy wrapper. As you expect, it first checks if the source and the destination buffers are valid, before forwarding on towards the original memcpy implementation. All of this additional checks mean that there will be a runtime overhead and you might be wondering what it is. The specifics heavily depend on your individual program. Address Sanitizer typically causes CPUs slowdown of about 2x, however we have seen it go as high as 5x in some edge cases, and the memory overhead is from 2 to 3x. One thing that I want to note here is that this overhead is much smaller than what you would get from other tools that find similar issues.
And compiling the compiler instrumentation with the runtime techniques is the key that makes Address Sanitizer so effective and scalable.
For example, we run and test Safari under Address Sanitizer. And that's a large app. And this was Address Sanitizer, new in Xcode 7.
Thank you.
Let's switch the focus a little bit, and take a closer look at other memory management tools that are also available to you on our platform, what they do and when you should use them.
So let's start off with Guard Malloc which finds some of the same issues as Address Sanitizer. And the main advantage of using Guard Malloc is that it doesn't require recompilation. On the other hand, it has other limitations as well. Guard Malloc does not work on iOS devices, and it also doesn't find all of the issues that Address Sanitizer finds.
For example, since it uses guard pages, it will not catch all of by-one buffer overflows, which is a common mistake to make.
These are the tradeoffs to consider when choosing which of the two tools to use. And also at your disposal is NSZombie, which is good for catching Objective-C object over-releases.
It works by replacing deallocated objects with zombie objects that trap when messaged.
The basic functionality can be enabled from the same Diagnostics tab in Xcode. However, if you want to gain full power of this feature do use Zombies Instrument.
Malloc Scribble will help in investigating uninitialized memory issues. It makes those errors much more predictable, by filling the allocated and deallocated memory with preset constants. And finally, the leaks Instrument will help you find retained cycles, and abandoned memory that leads to higher memory consumption. So to summarize, we have seen three different techniques that will help you get a deeper understanding of your program. First, use the View Debugger to find and fix constrained problems in your layout.
Second, set up breakpoint actions to automatically evaluate and print any LLVD expressions, and use the exception breakpoint to stop debugging your program right at the place where an exception occurs, and finally, third, use Address Sanitizer to scrub your applications clean of those elusive memory corruption bugs.
Here are some resources that you can use to learn more about what we have talked about today, and the sessions from earlier this week covered LLDB continuous integration and testing. You can watch them even once the conference is over. Thank you very much, and enjoy the rest of your day.
[Applause]
-