-
Explore power, performance, and scale for games on iPhone and iPad
Discover the Apple tools and technologies you can use to optimize game performance and power usage on iPhone and iPad. Learn how to use the Metal Performance HUD, Instruments, and Metal debugger to identify bottlenecks, improve efficiency, and scale your game across Apple devices.
This session was originally presented as part of the Meet with Apple activity “Press Start: Game development on Apple platforms.” Watch the full video for more insights and related sessions.Resources
Related Videos
Meet with Apple
-
Search this video…
Hi, everyone. Lionel here from the Metal Games Performance team.
Let's talk about power, performance and scale.
With Apple Silicon, we've created a unified gaming platform where the same modern rendering engine can can power your Mac. Yeah, can power your game across Mac iPad and right here on iPhone.
Bringing a high end game to a mobile device presents unique challenges. How do you deliver console quality, console quality experience with incredible performance that can be sustained through long play sessions? Over the next few minutes, I'm going to walk you through the tools and methodology we use at Apple to tackle this challenge. You'll live knowing not just what our tools do for you, but how you can apply this process to make your own games run beautifully.
First, you'll remember that my colleague Rich just highlighted many advanced features that Metal offers on the Mac. Let's see which of these can be used on the iPhone. Surprise! It's all of them.
The iPhone supports hardware accelerated ray tracing, mesh shading, and so much more. Your entire modern rendering engine, with all of its advanced features, can run on this small handheld gaming device, and you can use the MetalFX features, such as upscaling to render high quality frames with even greater performance.
As an example, let's look at the modern rendering sample. We've seen that it implements many advanced rendering techniques, and I've been toying with some experimental engine improvements. So does it still offer the smoothest experience? Let's find out.
This is the classic approach you can use for performance optimization. It's a systematic loop.
First, we observe and measure performance over a long gameplay period. Gameplay session to to to find inconsistencies.
Next, we isolate and analyze a problematic area to understand what's happening at the frame by frame level.
Then we diagnose and fix the root cause using our GPU debugging tools.
And finally, with our game running smoothly, we'll tune for power and scale.
We may need to do a few laps of this cycle to get to a good place.
So let's begin. The first step is to observe our game's behavior over a realistic PlayStation.
And our first tool in our observation toolkit is the is the Metal performance HUD. It's your live dashboard for spotting issues in real time throughout your development cycle and during QA. You can use the Metal performance HUD to get a good sense of your game's performance, and identify particularly particular scenes and areas that will require scrutiny.
At the top, you get some important context about your device, your display, your memory usage, and the thermal state. This is crucial for understanding the conditions under which you're capturing performance data.
Below that, you'll find your FPS and frame pacing charts. If you have some stutters, this is where they will be tracked. A smooth, flat line. Here is your goal. A jagged line with spikes like we're seeing here, is our first indicator that performance is inconsistent and needs investigation.
then a section for the CPU timings where you will see how much work went into populating the common buffers for your frame. This is also where you track your shader compilation. You'll typically have plenty of activity there at load time, and you can keep an eye on any runtime compilation that may be needed to make sure that it matches your expectations. If you see unexpected compilation during gameplay, it could be the source of a hitch.
And at the bottom you'll find the GPU timings, the cost of the vertex fragments, and compute shaders. This is also really useful to monitor how the work is overlapping within the frame and across consecutive frames, to make sure that some synchronization is not creating unexpected bubbles of idle time.
So the HUD tells us that we have a problem to understand when and why it happens over a long period of time, we need to move on to our next tool.
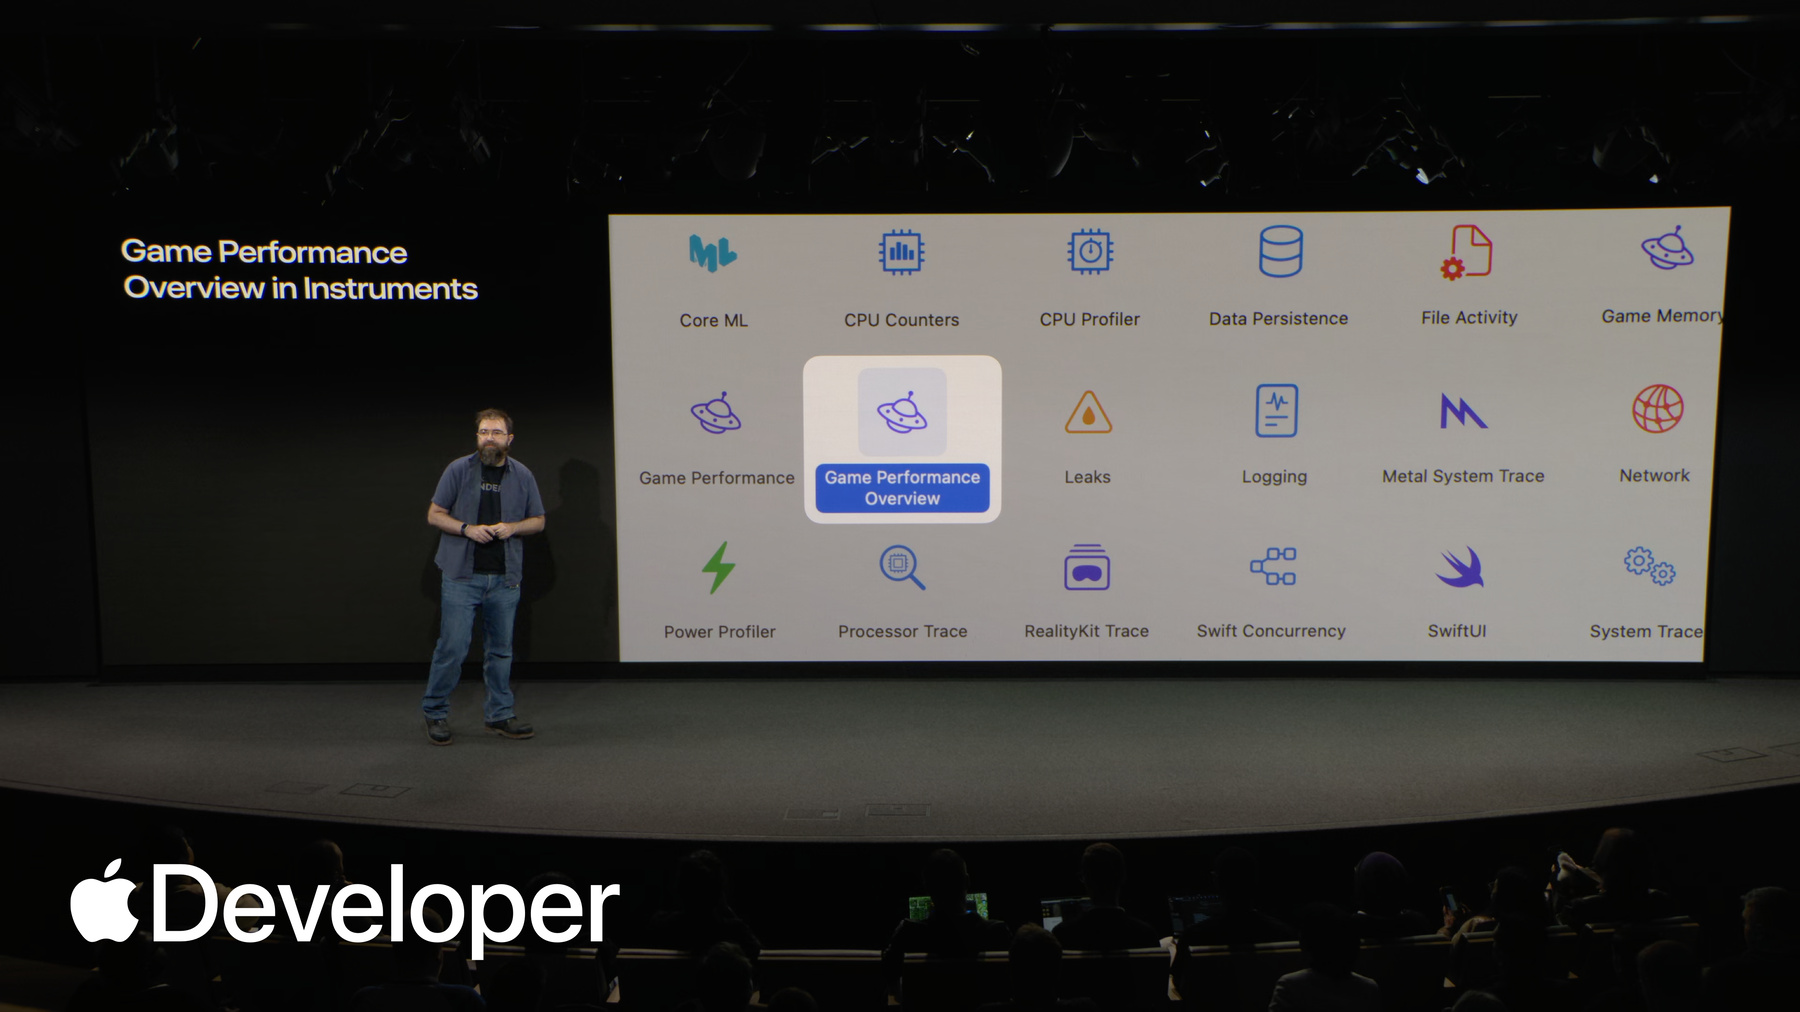
to capture that longer session, we'll use Instruments from Xcode.
From Xcode you can profile your game and select the Game Performance Overview template.
This tool supports really long captures over multiple minutes or even hours of of gameplay, making it ideal for identifying issues that only appear over time.
Here's the first five minutes trace of of our game.
There's a lot of data at this scale, so let's break down what we're seeing.
Zooming in, we can focus on some key tracks. The FPS and on display tracks display the same Stutter that we spotted before. That's good. We've reproduced the issue. The CPU tracks help us check on the latency. They show how long it took from the start of the frame on the CPU through to being displayed The GPU tracks showed the GPU activity and how long it takes for the frame to reach the display. There, we notice in this case that when we see the status, the GPU activity is high. This leads us to our next step.
So we found the problematic area in our long trace. Now we need to take a look more closely at just a few frames within that area to isolate the cause of the GPU activity. For this, we'll use the Metal System Trace template. It provides a detailed low level view of GPU hardware scheduling showing precise encoded timings and dependencies.
Let's open the GPU tracks and scrutinize our vertex fragment and compute encoders. One important aspect of of this view is that it would show the GPU work being overlapped between consecutive frames. But here we can see a lot of gaps in the GPU activity, and almost no overlap between the color coded frames.
This would point to a potential issue with our resource synchronization. Or maybe we're attempting to reuse resources that are still in use.
Now we have.
Now we have a great sense of what part of the engine is affected by the issue. Let's take a deeper look.
For this step, we'll switch back to Xcode and scrutinize a single frame. We'll use the Metal Debugger and take a frame capture. We run the game up to the challenging scene that we found, and let's click on the GPU capture icon.
After a few seconds, you get a summary.
There is a lot of information in this tool, so let's take a quick tour to see if we can find where the issue is.
In the performance section, you'll find an overview of the GPU timings and a list of the top shaders. This is really useful to identify which shaders to optimize if needed.
For even more detail, you can view the timeline which shows the GPU counter charts alongside a timeline of encoders. This is really powerful to dig in and find very specific encoders and shaders that require even more attention.
The heatmap is also very helpful to help understand that the GPU is doing a uniform amount of work across all pixels.
Other views are available to get all the information on the resources used by each encoder, and this is where you can browse your draw calls.
The memory view is also really useful to understand that the assets are in the right pools, properly compressed, are not leaking, and so on.
But we were looking for an unexpected synchronization point which prevents good overlap. So let's look at the dependency viewer and see what it shows about the synchronization between the encoders. Sync points can be implicit when the encoder writes into a render target and another encoder reads from a reads the result. Or it could be explicit, such as with metal fences.
So I've been playing with the sample. I added a Metal event to ensure that I can alias some resources into the same shared buffer, but the experiment has not paid off. I created a bottleneck in the pipeline right before the gbuffer, and it prevents the overlap that we wanted.
So I'll need to use separate render target for those passes to ensure that they can overlap. It involves multiple changes through my resources and encoder setup, and I need to remove this wait for Metal event.
After a quick build, let's check the results with the Metal performance HUD. We can see that the stutters are gone. Great. So the tools helped us witness a scene with stutters. Identify a tricky synchronization issue. Find which resources were affected. We fixed it and quickly verified the outcome.
We can also take a quick look back at the game performance overview and see that each frame is now perfectly paced. So we're good here, but if needed, we could take another lap of the analysis cycle to find and fix any remaining issues.
So finally, we'll tune our game settings to ensure that we're also using power efficiently.
Tuning can be a part of the analysis cycle, but is typically also a dedicated, final effort to polish everything. Now that the game is running well. So here's a checklist of the main ways to monitor and control your power usage.
First off, make sure that you've marked your game as a game in the info.plist as Alex showed earlier. It enables Game Mode, which ensures that your game has access to all available resources and limits background activity whilst your game is in the foreground. Next, enable Sustained Execution Mode. This gives your game a steady performance state from the start and throughout an extended play session.
This will give your player the best experience, but will also give you a good target for optimizations, and you can keep an eye on the thermal metric in the Metal performance hood. It will surface any unexpected issues to catch them early. If you have the Sustained Execution Mode enabled, the thermal state will remain will remain stable.
You may also want to track the thermal state within your game, to ensure that it is fully aware and in control of its impact, of its impact on the device's thermal state. You can simply use the NS Process Info API to receive the notifications or to check the current state.
This. This can be useful, as there are also external factors that can impact the device, such as ambient high ambient temperatures.
And you can use the Thermal Conditioner within the Xcode devices window to pretend that your device is under thermal stress, and that lets you tune your game to ensure that it continues to behave well in the face of unforeseen challenges.
And finally, on iOS, you have the Power Profiler in Instruments, which has charts for your CPU, GPU, and display power impact along with other information such as an overview of your Metal performance.
And now that you have the tools to track and improve your game's performance and power usage, you need to choose a good performance target for the different devices. Should you run at 30 FPS with medium settings, maybe on an older device? Or can you aim for 60 FPS with high settings on the latest device? Let's briefly discuss some of the choices to consider when targeting a range of small to large devices, each with their own power and performance characteristics.
When tuning your game, here are three main levels that that you can pull. The most impactful is rendering resolution. Depending on the complexity of your frame, you may be able to display to target the display native resolution. Otherwise, MetalFX can help bridge the performance gap. You can choose a fixed reduced resolution for your render target and use the MetalFX spatial or temporal upscaler to get a high quality final frame to display. MetalFX also supports dynamic resolution changes in case you want to adapt the quality of your image at runtime based on performance.
Next is your assets and feature quality. Things like geometry, levels of detail, texture, resolution with graphical effects are enabled. It's important to design good quality presets for the different devices.
And and this is also where you can have a tight loop around observing and tuning and the Metal performance and gain performance overview tools are essential here.
And finally, you can tailor the experience for the unique device capabilities of each display. With a gorgeous HDR display, your game can shine even brighter, and with ProMotion, you're not limited to just 30 or 60 fps, you could experiment with a smooth 48 or even 40 fps to get additional headroom to either increase the quality settings or reduce power usage.
Which brings us back to our original challenge. How do you deliver a console quality experience with incredible performance that can be sustained through a long play session? Well, we've discussed the tools and features that you can use to improve performance and control power usage on the iPhone, and with the unified gaming experience on all Apple devices. These same methods also work on Mac, iPad and Vision Pro.
So thank you for taking this journey with me through power and performance optimization. And now Dylan will go over important design considerations for your game. Thank you.
-