-
Behind the Scenes of the Xcode Build Process
Ever wonder what happens when you build your project in Xcode? Learn how Xcode automates the steps required to build an application, and go behind the scenes to learn how clang, swiftc, and the linker work together to turn your source code into a working program.
Resources
Related Videos
WWDC22
WWDC20
WWDC18
-
Search this video…
Good afternoon, everyone! Welcome to Behind the Scenes of the Xcode Build Process.
My name is Jake Petroules, and I'm an engineer on the Xcode Build System Team. And today we're going to be exploring the Xcode build process. I'll start by telling you all about Xcode 10's new build system which is written from scratch in Swift. And provides improved performance and reliability.
We'll answer questions like what exactly happens when you press Command B? How is the build process structured? And how does Xcode use the information in your project file to determine how to model and orchestrate the build process? Next we'll venture into the compiler realm. And find out about Clang and Swift builds your source code into object files.
We'll show how headers and modules work. See how the compilers find declarations in your code, and how the Swift compilation model fundamentally differs from that of C, C++ and Objective-C. Finally, we'll land at the linker which performs one of the final steps in the build process. We'll explain what symbols are and how they relate to your source code. And how the linker takes the object files produced by the compilers and glues them together to produce the final executable for your application or framework.
By the way, we're going to use a small sample app called PetWall as a running example throughout this talk. It's just a small iOS app that displays photos of our pets. So let's first understand what the build process is and how it works when building a typical app like PetWall in Xcode. You can see here we've got an app target, a framework, a bunch of different source code files in Swift and Objective-C. And maybe this looks a bit like your own project.
So when you build an app, there's a number of steps involved to go from the source code and resources in your project to the package that you're shipping to customers or uploading to the App Store for distribution. You have to compile and link source code. Copy and process resources like headers, asset catalogues and storyboards. And finally code sign and maybe even do some custom work in a shell script or a make file like building API documentation for your framework or running code linting and validation tools.
Now most of these tasks in the build process are performed by running command line tools. Like Clang, LD, AC tool, IB tool, Code sign, and so on.
These tools have to be executed with a very specific set of arguments and in a particular order based on the configuration of your Xcode project. So what the build system does for you is to automate the orchestration and execution of these tasks each time you perform a build.
And since there can be tens of thousands of tasks or even more involved in a build process with a complex graph of interdependencies. It's definitely not something you want to be manually typing into the terminal 110 times a day. Let the build system do that for you.
Now I mentioned that the tasks in the build process are executed in a particular order. Let's talk about how that ordering is determined and why it's important.
The order in which build tasks are executed is determined from the dependency information that is the tasks, the inputs that a task consumes, and the outputs that it produces.
For example, a compilation task consumes a source code file like PetController.m as input and produces an object file like PetController.o as output.
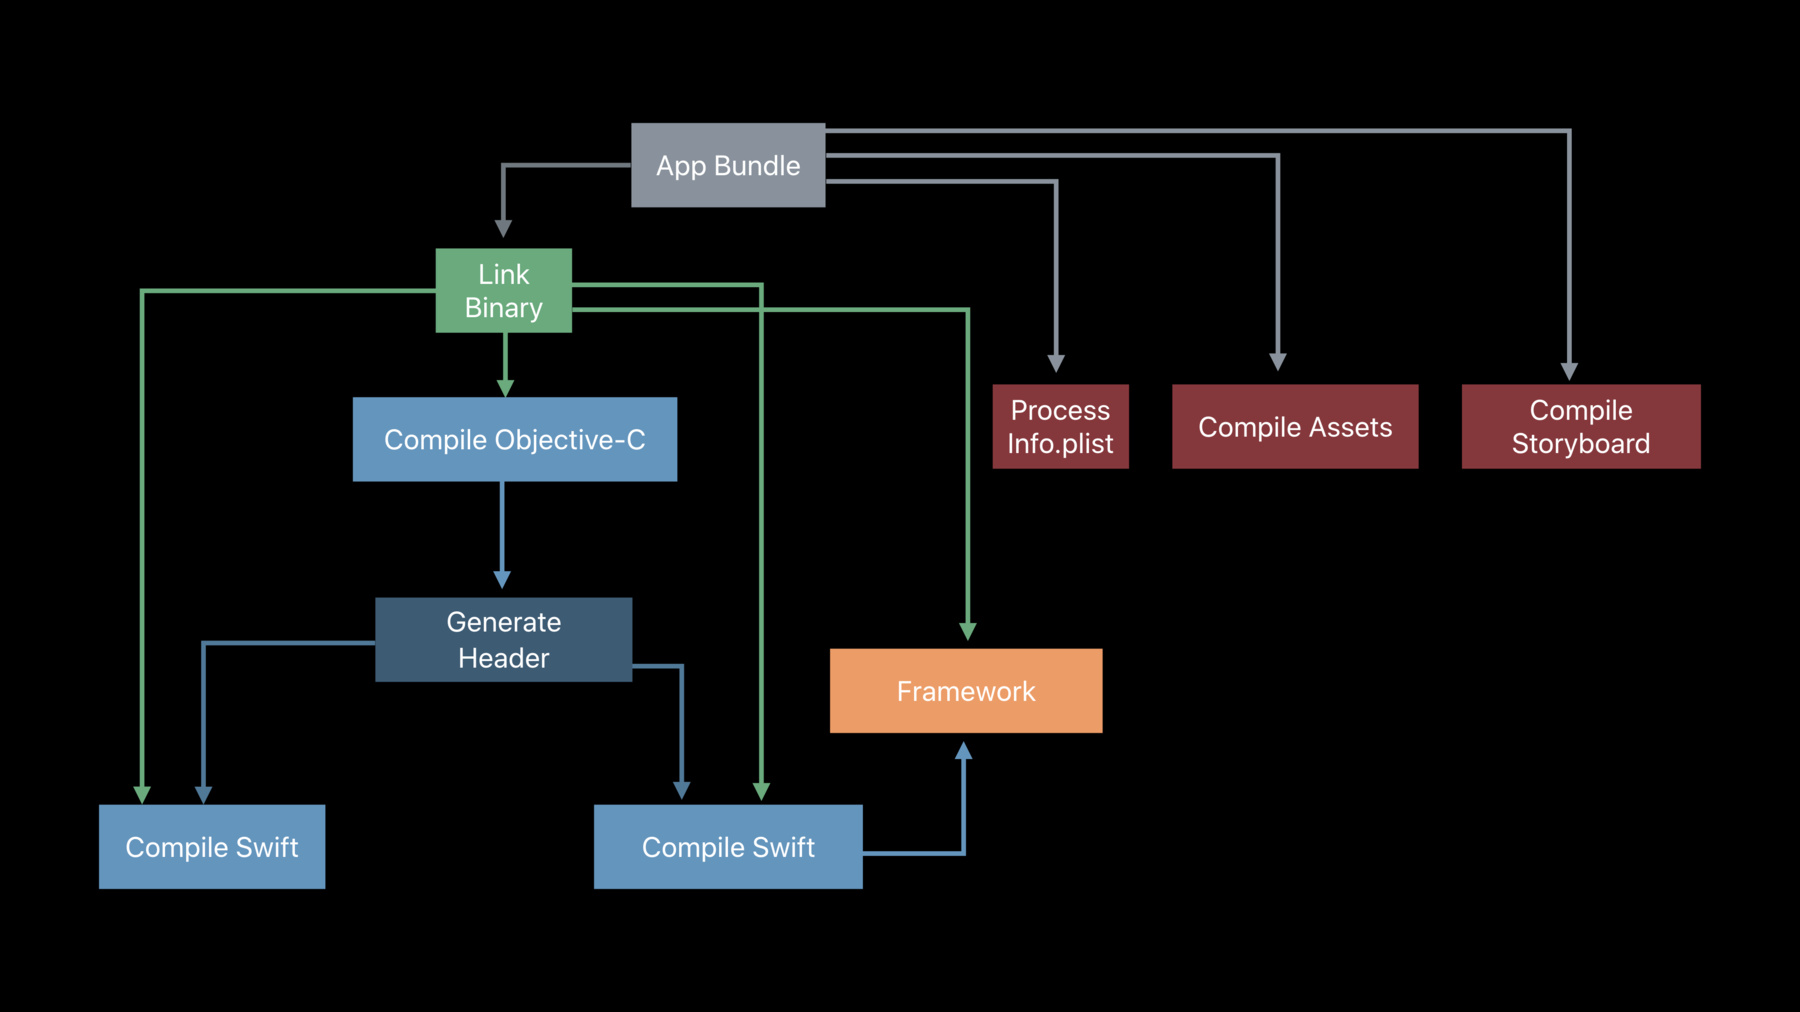
Similarly, a linker task consumes a number of object files produced by the compiler in previous tasks. And produces and executable or library output. Like the PetWall executable that will go into our .app bundle. And hopefully you're starting to see a bit of a pattern emerge here.
You can see how the dependency information flows through this graph structure which ultimately informs the order of execution.
Now if you look at the compilation tasks in the graph as sort of like lanes of traffic. You can see hoe the compilation tasks are totally independent in their own lanes and can therefore run in parallel. And because the linker task takes everything else's input, we know that has to come last.
So the build system uses dependency information to determine the order in which tasks should be run and which tasks can be run in parallel and we call this dependency order.
Now that we've covered what the build process is, let's go into a little more detail on how it works.
What happens when you press build? So the first step is for the build system to take the build description, your Xcode project file. Parse it, take into account all the files in your project, your targets and the dependency relationships. Your build settings, and turn it into a tree-like structure called a directed graph. And this represents all the dependencies between the input and output files in your project and the tasks that will be executed to process them. Next the low-level execution engine processes this graph, looks at the dependency specifications and figures out which tasks to execute. The sequence or order in which they must be run and which tasks can be run in parallel. Then proceeds to execute them.
And by the way, our low-level build execution engine for the new build system is called llbuild. And it's open source and developed on GitHub. If you're interested in build systems development, feel free to check it out and see how it works. We'll have a link to this and other open source components related to the build process at the end of the talk.
Okay, let's talk about discovered dependencies. Now since you can never have too much dependency information, the build system might actually discover more information during the task execution process.
For example, when Clang compiles an Objective-C file, it produces and object file as you'd expect. But it can also produce another file that contains a listing of which header files were included by that source file. Then the next time you build, the build system uses the information from this file to make sure that it recompiles the source file if you change any of the header files that it includes. And you can see the dependency path through PetController.h, PetController.d, .n, all the way to the .o file.
Now we've been talking a lot about how the build system's main job is to execute tasks.
And of course the bigger your project, the longer the build process will take. So you don't want to run all of these tasks every single time you build.
Instead, the build system might only execute a subset of the tasks on the graph. Depending on the changes you've made to your project since the previous build.
We refer to this as an incremental build and having accurate dependency information is very important in order for incremental builds to work correctly and efficiently. Now we talked about how changes affect the build system, and how they relate to incremental builds. So how does the build system actually detect changes? Each task in the build process has an associate signature which is the sort of hash that's computed from various information related to that task.
This information includes the stat infor of the task's inputs like file paths and modification time stamps. The command line indication used to actually perform the command. And other task-specific metadata such as the version of the compiler that's being used.
The build system keeps track of the signatures of tasks in both the current and the previous build. So that it knows whether to rerun a task each time a build is performed.
If the signature of any given task is different than the signature that it had in the previous build, then the build system reruns that task.
If they're the same, then it's skipped. That's the basic idea behind how incremental builds work.
So now that we have an idea of what the build process is and how it works, how can you help the build system do its job? Let's go back to basics for a moment. A build process is a series of tasks executed in a particular order. But remember that the build is represented as a directed graph.
So we don't want to think about the order in which these tasks should be executed because that's the build system's job.
Instead, as developers, we need to think about dependencies between tasks and let the build system figure out how to best execute them according to the graph's structure. This lets the build system order tasks correctly and parallelize where possible in order to take full advantage of multicore hardware.
So where do dependencies come from? For certain tasks, dependency information comes from knowledge built into the build system. The build system ships with rules for the compiler, the linker, the asset catalogue and story board processors and so on. And these rules define what kind of files are accepted as inputs as well as what outputs are produced.
There's also target dependencies which roughly determine the order in which targets are built.
And in some cases, the build system can compile sources of different targets and parallel. Previously in Xcode, when a target was built, it required the compilation of the entire dependent target to be completed before it could start.
In Xcode X's new build system, targets can start building sooner. This means that your compile sources phase can start earlier providing your some parallelization for free. However, note that if you're making use of any run script phases, those script phases will need to complete before this parallelization can take effect. Somewhat related to target dependencies are implicit dependencies.
For example, if you list a target in your link library with binaries build phase and implicit dependencies are enabled in the scheme editor, that's on by default, by the way, the build system will establish an implicit dependency on that target even if it's not listed in target dependencies.
Next up are build phase dependencies. In the target editor, you'll notice that there's a number of build phases. Copy headers, compile sources, copy bundle resources and so on.
The tasks associated with each of these phrases are usually running groups according to the order in which the phases are listed. But the build system might ignore that order if it knows better. Like if you have a link library, linked binary with library space ordered before compile sources. And note that there's cases where having the wrong build phase order can cause build issues or failures, so make sure to understand your dependencies and verify that your build phases are in the right sequence.
There's also scheme order dependencies. If you have the parallelize build check box enabled in your scheme settings, you get better build performance and the order of your targets in your scheme doesn't matter. However, if you turn parallelize build off, Xcode will attempt to build their, your targets in the order you listed them in the build action of the scheme one by one. Target dependencies still have higher priority in determining which targets build first. But otherwise, Xcode will respect that ordering. Now it might be tempting to use this as it gives you a predictable build order even if you haven't set your dependencies correctly. But you're sacrificing a lot of parallelization when you do this and slowing down your build. So we recommend that you leave the parallelize builds checkbox enabled, set up your target dependencies correctly and don't rely on ordering.
Lastly, dependency information comes from you, the developers. If you're creating custom shell script build phases or build rules, make sure to tell the build system what its inputs and outputs are. This lets the build system avoid rerunning the script tasks unnecessarily. And can help make sure that they are executed in the right order. You can define the inputs and outputs in the run script phase editor. And the paths of these files will be made available to your script as environment variables.
Don't rely on auto-link for target dependencies in your project.
The client compiler has a feature called auto-link which can be enabled using the link frameworks automatically build setting.
This setting allows the compiler to automatically link to the frameworks corresponding to any modules you import without having to explicitly link them in your link library's build phase. However, it's important to note that auto-link does not establish dependency on that framework at the build system level. So it won't guarantee that the target you depend on is actually built before you try to link against it. So you should rely on this feature only for frameworks from the platform STK. Like Foundation and UIKit since we know those will already exist before the build even starts. For targets in your own projects, make sure to add explicit library dependencies.
You might also need to create project references by dragging and dropping another Xcode project into your project's file navigator in order to reveal the targets of other projects you depend on. In conclusion, with accurate dependency information, the build system can better parallelize your builds, and help ensure that you get consistent results every time so that you can spend less time building and more time developing.
For more information on how to speed up your builds and make the most of all those cores in your shiny new iMac Pro, we'd recommend that you check out Building Faster in Xcode Session. And with that, I'm going to hand it over to Jurgen, who's going to take you into the realm of the compiler. Thank you, Jake.
And now we're going to talk about what happens behind the scenes when Xcode build system invokes the Clang compiler.
Hello, everyone. My name is Jurgen, and I'm a Compiler Engineer on a Clang Frontend Team.
Today I'm going to talk about two features you might not know about.
The first feature is called header maps and how we use them to communicate information from the Xcode build system to the Clang compiler.
The second feature is called Clang modules and how we use them to speed up your builds. Some of you might only use Swift by now.
But I want to tell you, Swift uses Clang behind the scenes. So there might be something interesting for you here, too.
So what is Clang? Clang is Apple's official C compiler and all the other C language family such as C, C++, and of course Objective-C which is used for the majority of all frameworks. As Jake mentioned in the beginning, the compilers invoked for every input file and it creates exactly one output file which is then later consumed by the linker.
If you want to access APIs from the iOS, or you want to access implementations from your own code, you usually have to include something what is called a header file. A header file is a promise.
You promise somewhere else this implementation exists. And they usually match. Of course if you update only the header file-- only the implementation file and forget the header file, you broke your promise. Very often this doesn't break the compile time because the compiler trusts your promise.
Usually this breaks during link time. The compiler usually does include more than one header file, and this is done for all compiler invocation.
So let's have a look at our example application and see how we deal with header files.
This is PetWall, it's a mixed-language application.
The application itself is written in Swift.
And it uses a framework that's written in Objective-C. And it has a support library aesthetic archive that use-- that's written in C++. Over time, our application grew. And we start to reorganize it so we can find things easier. For example, we moved all the cat-related files into a subfolder. We didn't have to change any of our implementation files.
And it still works.
So it makes you wonder how does Clang find your header files? Let's look at a simple example.
This is one of our implementation files we use in our code and we include our header file called cat.h. How can we figure out what Clang does? Once thing you could do is you can go into the build logs, look what the Xcode build system did to compile this particular file. And copy and paste that invocation.
You drop it into a terminal and add the -v option.
Dash-v is symbol for verbose.
And then Clang will tell you lots of information.
But let's just concentrate on the one that matter which is the search paths. I say search paths and many of you might expect to see now here search paths that point back to your source code. But it's not how this works.
Instead you will see something called headermaps.
Headermaps are used by the Xcode build system to communicate where those header files are.
So let's have a look at those. Let's have a look the most important two file-- headermap files we care about.
The first two entries simply append the framework name to your header. Those two headers in the beginning are public headers.
I say you shouldn't rely on this feature. The reason is we keep this there to keep existing projects working but there might be issues down the road with Clang modules so we suggest that you always specify the framework name when you include a public or private header file from your own framework.
Third entry is a project header. In this case, this is not required.
And the whole purpose of the headermap is to point back to your source code. As you can see, we do the same thing for the public and private headers.
We always point back to your source code. We do this so that Clang can produce useful error and warning messages for the files in your source directory and not a potential copy that might be somewhere else in the build directory. Since many people were not aware that we use headermaps, you run into certain issues. A very common one is that we forgot to add the header to the project.
It is in the source directory, but it is not in the project itself. So always add your headers to the project.
Another issue is that if you have headers with the same name, they might shadow each other.
So always try to use unique names for your headers.
This also applies to system headers. If you have a local header in your project that has the name as a system header, it will shadow the system header so you should try to avoid this.
Talking about system headers. How do we find those? Another example from our PetWall.
Here in this case we include Foundation.h header file which is in our SDK. We can do the same thing we did before when you were looking for our own header files. But now we're looking for the system header.
It's just that headermaps are only for your own headers. So we can ignore them.
Let's focus on the include path matter. So at default, we always look in two directories in the SDK. the first one is user include, the second one is system library frameworks. Let's have a look at the first one. It's a regular include directory. So the only thing we have to do is we have to append the search term. In this case, Foundation/Foundation.h. And we won't find the header because it's not there.
But it's okay. Let's try the next entry.
Let's look into system library frameworks.
This one is a frameworks directory that means Clang has to behave a little bit different. First of all, it has to identify what is the framework and check if the framework exists. After that, it has to look in the headers directory for the header file.
This case, it finds it so it's fine.
But what happens if we don't find the header? For example, we have a bogus header that doesn't exist.
It obviously fails to find it in the headers directory. But the next, it will also look in the private headers directory.
Apple doesn't ship any private headers in its SDK. but your project, your frameworks might have public and private headers. So we always will look there too.
Since it's a bogus header, it's not there either. Interesting now, we actually will abort the search now. We will not keep searching in other search directories. The reason is we already found the head-- we already found the framework.
Once you find the framework, we expect to find the header in this framework directory. If you don't find it, we complete abort the search. If you're curious how your implementation file looks like, after all those headers got imported and preprocessed. You can ask Xcode to create a preprocessed file for you, for your implementation file. This will create a very large output file. So how big is that file? Let's use a very simple example.
Foundation.h is a very fundamental header, fundamental header to our system. It is-- you are very likely to import this header either directly or indirectly for some other header file. That means every compiler invocation you're most likely going to have to find this header.
At the end of the day, Clang has to find and process over 800 header files for the single include statement.
That's over 9 megabyte of source code that has to be parsed and verified.
And that happens for every compiler invocation. That's a lot of work, and it's redundant.
So can we do better? One of the features you might be aware of is called precompiled header files. That's one way to improve this.
But we have something better. A few years back, we introduced Clang modules.
Clang modules allow us to only find and parse the headers once per framework and then store that information on disk so it's cached and can be reused.
This should have improved your build times.
In order to do that, Clang modules must have certain properties. One of them, one of the most important one is context-free. What do I mean by context-free? You can see here two code snippets. In both cases we import the PetKit module.
But we have two different macro definitions beforehand.
If you would use a traditional model of importing those headers, that means they're included. The preprocessor would honor this definition and apply it to the header file.
But if you would do that, that means the modules would be different for each header case, and we couldn't reuse it. So if you want to use modules, you cannot do that. Instead, the module will ignore all those context-related information that allows us to be, that allows it to be reused across all implementation files.
Another requirement is modules have to be self-contained.
That means they have to specify all the dependencies.
Which also has a nice advantage for you because it means once you import a module, it will just work. You don't have to worry about adding any additional header files to make that import work.
So how do we know or how does Clang know it should build a module? Let's look at a simple example here NSString.h. First Clang has to find this particular header in the framework. And we already know how to do that. And it's the Foundation.framework directory.
Next the Clang compiler will look for a modules directory and a Module Map relative to the header's directory and it's there.
So what is a Module Map? A Module Map describes how a certain set of header files translate onto your module.
So let's have a look.
The Module Map is actually very simple. This is the whole Module Map for foundation. That's it.
It obviously describes what is the name of the module which is, Foundation. And then it also specifies what headers are part of this module.
You'll notice there's only one header file here, only Foundation.h. But this is a special header file. This is the umbrella header which is also marked by the special keyword umbrella.
That means Clang has also to look into this particular header file to figure out if NSString.h is part of the module.
And yeah, it's there, okay. So now we have found out NSString.h is part of the foundation module.
Now Clang, now Clang can upgrade this textual import to a module import and we know we have to build the foundation module to do that. So how do we build the foundation module? First of all, we create a separate Clang location for that.
And that Clang location contains all the header files from the foundation module. We don't transfer any of the existing context from the original compiler invocation. Hence, it's context-free.
The thing we actually transfer are the command line arguments you passed to Clang. Those are passed on. While we build the foundation module, we mod-- the module itself or the framework, the framework itself will include additional frameworks. That means we have to build those modules too.
And we have to keep going because those might also include additional frameworks.
But we already can see there is a benefit here.
Some of those imports might be the same. So we can always start reusing that module. All those modules are to disk into something called a module cache. As I mentioned, the command line arguments are passed on when you create that module.
That means, that means those arguments can affect the content of your module.
As a result, we have to hash all those arguments and store the modules we created for this particular compiler invocation in a directory matching that hash. If you change the compiler arguments for different limitation file, for example you'd say enable cat, that is a different hash and that requires Clang to rebuild all the module's inputs into that directory matching that hash.
So in order to get the maximum reuse out of the module cache, you should try to keep the arguments the same, if possible. So this is how we find and build modules for system frameworks but what about your frameworks? How do we build modules for those? Let's go back to our original cat example, and this time we turn on modules. If we would use a headermap again, the headermap will point us back to the source directory. But if you look at that source directory, we have a problem now. Theirs is no modules directory.
It doesn't look like a framework at all and Clang doesn't know how to do this in this case.
So we introduced a new concept to solve this, and it's called Clang's Virtual File System.
It basically creates a virtual abstraction of a framework that allows Clang to build the module.
But the abstraction basically only points to the files back in your directory. So again, Clang will be able to produce and errors for your source code. And that's how we build modules for, when you have frameworks. As you remember, in the beginning I mentioned there might be issues if you don't specify the framework name. So let me give you an example where this can go wrong. This is a very simple-- very simple code example. We only have two imports. The first import imports the pet, PetKit module.
The second import, you and I know this is also part of the PetKit module, but Clang might now be able to figure that out because you didn't specify the framework name. In this case, it might be possible you get duplicate definition errors. That's basically, that basically happens when you import the same header twice.
Clang works very hard behind the scenes to fix the most common issues that happen like this.
But it cannot fix all of them.
And this is just a simple example.
Let's just make a little tweak. Let's change the context.
Now the module import won't be affected by this at all because as I said, we ignore the context. The cat import is still a textual inclusion of the header which will observe this change.
So now you might not even have duplicate definitions. You might even have contradictory definitions. Which can mean we cannot fix, Clang cannot fix this for you.
So as I recommended in the beginning, always specify the framework name when you import your public or private headers.
And now I'm handing it over to Devin who's going to talk about Swift and how Swift uses Clang modules. Thanks, Jurgen. We're now going to dive into the details of how Swift and the build system work together to find declarations across your project.
To recap some of what Jurgen told you, Clang compiles each Objective-C file separately.
This means if you want to refer to a class to find in another file, you have to import a header that declares that class. But Swift was designed to not require you to write headers. This makes it easier for beginners to get started with the language. And avoids you having to repeat a declaration in a separate file.
However this does mean that the compiler has to perform some additional bookkeeping.
I'm going to tell you how that bookkeeping works. Let's return to our example, PetWall app.
The app has a view in ViewCcontroller, written in Swift.
An Objective-C app delegate. And Swift unit tests.
In order to compile even just this top PetViewController part of the file, the compiler has to perform four different operations.
First, it has to find declarations.
Both within the Swift target and also coming from Objective-C.
Further, it has to generate interfaces describing the contents of the file. So that its declarations can be found and used in Objective-C and in other Swift targets.
In the rest of this section of the talk, I'm going to walk through this example to illustrate each of these four tasks.
Let's start with finding declarations within a Swift target.
When compiling PetViewController.swift, the compiler will look up the type of PetView's initializer so that it can check the call.
But before it can do that, it needs to parse PetView.swift and validate it. To make sure that the declaration of the initializer is well formed.
Now, the compiler's smart enough to know that it doesn't need to check the body of the initializer here.
But it does still need to do some work just to process the interface parts of the file.
What this means is that unlike Clang, when compiling one Swift file, the compiler will parse all the other Swift files in the target. To examine the parts of them that are relevant to the interfaces.
IN Xcode 9, this resulted in some repeated work in repeated build-- in incremental debug builds. Because the compiler compiled each file separately.
This enabled the files to be compiled in parallel, but it forced the compiler to repeatedly parse each file.
Once as an implementation to produce a .o, and multiple times as an interface to find declarations.
Xcode 10 reduces this overhead.
It does so by combining the files into groups that share as much work as possible. While still allowing maximum parallelism.
This reuses parsing within a group and only repeats work across groups.
Since the number of groups is typically relatively low, this can significantly speed up your incremental debug builds.
Now, Swift code doesn't only call other Swift code. It can also call Objective-C. Returning to our PetWall example app, we can see that, that this is crucial since the system frameworks such as UIKit are written in Objective-C.
Swift takes a different approach than many other languages. And it doesn't require you to provide a foreign function interface.
This is where you would have to, for example, write a Swift declaration for each Objective-C API you want to use.
Instead, the compiler embeds a large part of Clang inside of it and uses it as a library.
This makes it possible to import Objective-C frameworks directly.
So where do Objective-C declarations come from? The compile-- the importer will look in headers depending on the type of the target.
In any target, when you import an Objective-C framework, the importer finds declarations in the headers exposing Clang's module map for that framework.
Within a framework that mixes Swift and Objective-C code, the importer finds declarations in the umbrella header.
This is the header that defines the public interface.
In this way, Swift code inside the framework can call public Objective-C code in the same framework.
Finally, within your app and unit tests, you can add imports to the target's bridging header. To allow declarations from them to be called from Swift. Now when the importer brings in declarations, it often changes them to make them more idiomatic.
For example, it will import Objective-C methods that use the NSError idiom as throwing methods using Swift's built-in error handling language feature. In particular, it will drop parameter type names following verbs and prepositions.
For example, the drawPet atPoint method has the word pet.
For a parameter of type pet following the verb draw.
And similarly the word point for a parameter of type CGPoint following the preposition at.
These words are omitted in Swift when the method is imported as simply draw at.
So how does this work? Well, you might be surprised to know that the compiler contains a list of common English verbs and prepositions.
Because it is just a hard-coded list and human language is messy, sometimes it's missing words.
Furthermore, in order to match Swift's naming conventions, the importer will also rename methods to remove words based on the part of speech.
For example the verb feed is not in the list, and so feedPet is not imported as feed as we might expect.
When this happens, you can use the NS Swift Name annotation to have the compiler import the method exactly as you want.
Now if you want to check to see how your Objective-C header will be imported into Swift, you can always go to Xcode's related items popup. This is in the upper left-hand corner of the source editor. If you select generated interfaces, it will show you how the interface will look in different versions of Swift.
So that's how Swift imports Objective-C.
But what about the other direction? How does Objective-C import Swift? The answer is that Swift generates a header that you can pound import.
This allows you to write classes in Swift and call them from Objective-C.
Let's see how this works. The compiler will generate Objective-C declarations for Swift classes extending NSObject and methods marked at obc. For apps in unit tests, the header will include both public and internal declarations. This allows you to use internal Swift from the Objective-C parts of your app.
For frameworks, however, the generated header provides only public declarations. Since it's included in your build products and it's part of the framework's public interface. On the right, you can see that the compiler ties the Objective-C class to the mangled name of the Swift class which includes the name of the module, PetWall. Now I'm going to tell you about modules in a bit, and Louis will tell you about mangling. But for now, the thing to know is that this prevents a conflict in the runtime when the two modules define a class with the same name. You can tell Swift to use a different name for the class in Objective-C by passing an identifier to the obc attribute.
But if you do this, you're responsible for making sure the names don't conflict.
Here I've used the PWL prefix so to reduce the likelihood of a conflict.
With this change, I can refer to the class as PWLPetCollar in Objective-C.
The compiler takes a similar approach to generating interfaces to other Swift targets. To do this, Swift builds on Clang's concept of a module, which Jurgen told you about.
And more deeply integrates it into the language.
In Swift, a module is a distributable unit of declarations. And to be able to use those declarations you have to import the module.
You can import Objective-C modules. XEtest, for example.
And in Xcode each Swift target produces a separate module. Including your app target.
This is why you have to import your app's main module in order to test it from your unit tests. When importing a module, the compiler deserializes a special Swift module file to check the types when you use them.
For example, in this unit test, the compiler will load the PetViewController parts of the PetWall Swift module to make sure that you're creating the controller correctly.
This is similar to how the compiler finds declarations within a target as I showed you earlier.
Except that here, the compiler loads a file summarizing the module rather than parsing Swift files directly.
The compiler produces this Swift module file a lot like a generated Objective-C header.
But instead of text, it's a binary representation.
It includes the bodies of inlineable functions much like static inline functions in Objective-C or header implementations in C++.
However, one thing to be aware of is that it does include the names and types of private declarations.
This allows you to refer to them in the debugger which is really handy. But it does mean that for example, you shouldn't name a private variable after your deepest, darkest secret.
For incremental builds, the compiler produces partial Swift module files and then merges them into a single file that represents the contents of the entire module.
This merging process also makes it possible to produce a single Objective-C header.
In many ways, this is similar to what the linker does when it smooshes together your object files into a single executable.
And to tell you more about that, I'll hand it off to Louis and the linker.
Louis? Thank you, Devin. Hi, I'm Louis Gerbarg. I work on the linker. Which is one of the final steps in the Xcode build process. So let's get to it. So first off I want to go over what we're going to talk about.
We're going to talk about what a linker is.
We're going to talk about the input that it takes which are dylibs and object files and what they are. And we're also going to talk about symbols which are what those contain.
So at the end of this, I'm going to tie this together with an act-- with an example because this is pretty dense stuff. So if it seems a little confusing. Hold on, and hopefully we'll make it clearer. So what is the linker? It's like I said, it's one of the final processes in the build. And what we do is we combine all of these .o files that have been built by the two compilers into an executable.
All it does is move and patch code. It cannot create code, and this is important and I will show that in the example.
But we take these two kinds of input files. The first one being dylibs or being libraries. There are multiple-- the first one being object files. Which are what come out of your build process. And the second one being libraries which consist of several types including dylibs, tbd's, and .a files or static archives.
So what are symbols? A symbol is just a name to refer to a fragment of code or data.
These fragments may refer to other symbols which you would see if you write a function that calls another function.
Symbols can have attributes on them that affect how the linker behaves. And there are a lot of these. I'm just going to give you one example which is a weak symbol. So a weak symbol is an annotation on a symbol that says it might not be there when we run the syst-- when we build the, when we run the executable on the system. This is what all the availability markup that says this API is available on iOS 12. And this API's available on the iOS 11. This, that's what it all boils down to by the time it gets to the linker. So the linker can determine what symbols are definitely going to be there versus what symbols it may have to, it may have to deal with at runtime.
Languages can also encode data into the symbol by mangling it, as Devin mentioned earlier. And you'll see that in both C++ and Swift. So we have symbols which are these names referring to code and data. So the compilers generate object files. And those object files are just collections of those code and data. They are not executable. While they are compiled code, they aren't finished. There are bits missing which is what the linker's going to glue together and fix up. Each fragment in one of those files is represented by a symbol. So for the printf function, there's code represented by a symbol. For any of the functions in PetKit which we're going to see in a second, the same thing. And fragments may reference undefined symbols. So if your .o file refers to a function in another .o file, that .o file's undefined. And the linker will go and find those undefined symbols and link them up. So I said that object files are the output of your compiler actions. So what are libraries? Libraries are files that define symbols that are not part of the target you are building.
So we have dynamic libraries, and those are Mach-O files that expose code and data fragments for executables to use.
Those are distributed as part of the system. That's what our frameworks are. And a number of you also use your own frameworks. There are also TBD files, or text-based dylib stubs. So what are those? Well, when we made the SDKs for iOS and macOS, we had all these dylibs with all these great functions like MapKit and WebKit that you may want to use. But we don't want to ship the entire copy of those with the SDK because it would be large. Ant the compiler and linker don't need. It's only needed to run the program. So instead we create what's called a stub dylib where we delete the bodies of all of the symbols and we just have the names.
And then once we did that, we've made a textual representation of them that are easier for us to use. Currently, they are only used for distributing the SDKs to reduce size.
So you may see them in your project, but you don't have to worry about them. And they only contain symbols.
Finally, we have static archives. So static archives are just collections of .o files that have been built with the AR tool or in some cases the lib the lib tool which is a wrapper for that. And according to the AR page, the AR utility creates and maintains groups of files combined into an archive.
Now that may sound a lot like a TAR file or a ZIP file, and that's exactly what it is. In fact, the .a format was the original archive format used by UNIX before more powerful tools came around.
But the compilers of the time and the linkers of the time natively understood them, and they've just kept using them. So it really is just an archive file.
One thing worth noting is they also prenate dynamic linking so back in those days, all of the code would be consid-- would be distributed as archives. Because of that, you might not want to include all of the C library if you're using one function. So the behavior is if there's a symbol in a .o file, we would pull that whole .o file out of the archive. But the other .o files would not be brought in. If you're referencing symbols between them, everything you need will be brought in. If you're using some sort of non-symbol behavior like a static initializer, or you're re-exporting them as part of your own dylib, you may need to explicitly use something like force load or all load to the linker to tell it bring in everything. Or these files, even though there's no linkage. So let's go through an example to try to tie this altogether.
So up on stage we have an example of a playSound function because what fun would be looking at pets without listening to them? And you know it calls playSound. You know, there's a function on cat that calls playSound. That seems pretty simple. So let's look at the assembly that generates. So here's cat.o that comes out of it. Now if we look, we can see we have the string purr.aac which would be our AAC sound file. And that gets copied into cat.o. You'll note that the name purr file does not appear in there anywhere. The reason is, that's a static. And those of you who are familiar with C, that means it's a nonexported name. Nobody else can refer to it. Since nobody else can refer to it, we don't need it. It's not included.
And then we see Cat purr becomes an actual symbol: dash, open bracket, Cat purr, close bracket.
Pretty much what you'd expect. And then we see we actually have to get this variable we're going to pass into playSound. And you'll note there are two instructions referring to that. And that's because we don't know where this string is going to end up in the final executable. We don't have a concrete address for it. But we know that on RM64 which is what this assembly is, it could take at most two instructions. So the compiler leaves us with two instructions. And it leaves the symbolic offset, the symbolic values page and page off that the linker will come in and fix up later.
Finally, now that we've loaded that string into x0, we can call playSound except for we're not calling playSound. We're calling underbar underbar z9playSound PKc. Now what is that? That's a mangled symbol because if you note, it says cat.mm. This is Objective-C++. And playSound is actually a C++ function.
So if you're not familiar with those, you can go to terminal and you can actually use tools. So if you run Swift-demangle and pass in a symbol, it will attempt to demangle it. It didn't work. It's not a Swift symbol. But C++ filts, which is the C++ demangler shows us that this is in fact a symbol for playSound. But not only is it playSound, we know it takes one argument. And that one argument is a const char star because C++ encoded that extra data into the mangled symbol. Okay, so now we have a .o. In fact, we're building a project, we'll have a lot of them. So what are we going to do with that? Well, first off, the build system is going to pass all of the .o's in as inputs to the linker. And the linker's going to start by creating a file to put them in. In this case we're building PetKit which is an embedded framework inside of PetWall. And so we'll just start by copying. We'll create what's called a text segment.
Which is where we keep all of the code for an application. And we'll take the cat.o and we'll copy it in. But we're going to split it into two sections. One for that string, and one for the executable code. But we now know the absolute addresses of these things so the linker can go and rewrite cat.o to load from a specific offset. You'll notice that the second instruction just went away. We replaced it with what, with a null instruction that does nothing.
But we cannot remove the instruction because we can't create or remove code. It would mess up all of the sizing that we've already done. So instead it just is removed. It, it's just replaced with a no operation. Finally we branch.
Okay, but we branch and what are we going to do? Because we have this undefined symbol? Well, we're going to go and keep looking through, and all of our .o's have been included at this point.
So we'll start looking at the static archives and PetSupport.a is there. And inside of PetSupport.a, we have a couple of files including PetSounds.o. And if we look, we see that matching file-- that matching symbol for playSound.
So we pull it in. We'll note that we do not pull in PetCare.o. Because that .o file did not have any symbols that were referred to by any of the other portions of the application. Okay, so we pulled that in, but now that needs, open which we didn't define. You'll see in the, in the, the conversion we copied in. We actually replaced it with something called open$stub. Now why did we do that? Well we kept looking, and we found a copy of open. And that copy of open is in the lib system TBD file.
And so we said I know this is part of the system library. I'm not going to copy this into my application. But I need to put enough information in the information to make it so that it can call this. So we create a fake function that's just a template where we replaced a function with whatever we're pulling out of lib system which is open in this case. And if you look in that function, it actually loads from a pointer, open$ pointer.
And jumps to it. So we just need a function pointer, just like any normal C function pointer. And we'll create that down in the data segment which is where global variables would be if you had any globals.
But it's just set to zero. So if we dereference null and jump to it we're going to crash.
So we then add what's called a link edit segment. And the link edit is metadata that the linker tool uses to leave information for the operating system and what's called the dynamic linker to fix this up at runtime. And for more information on that you should look at the Optimizing App Startup Time session from 2016. So I just want to go back over what we went through today. So Jake talked about the build system and how you can use dependencies to optimize your built process for multi-core. Jurgen walked through Clang and how it finds headers for you. And what you can do to optimize your build-through modules.
Devin walked through how Swift expand modules and all of the things that we've implemented this year like processing to speed up your builds. And then finally the linker takes the outputs of both compilers and builds them into your application. At which point Xcode will go and, and code and package it up with other parts of your application for distribution.
So most of this is open source, available if you're really curious. You can look at Swift or Clang or the llbuild execution engine at these URLs.
And I just want to thank you all for coming. And I hope you've had a great WWDC. And we'll be in the labs. Thank you. [ Applause ]
-