Metal developer tools

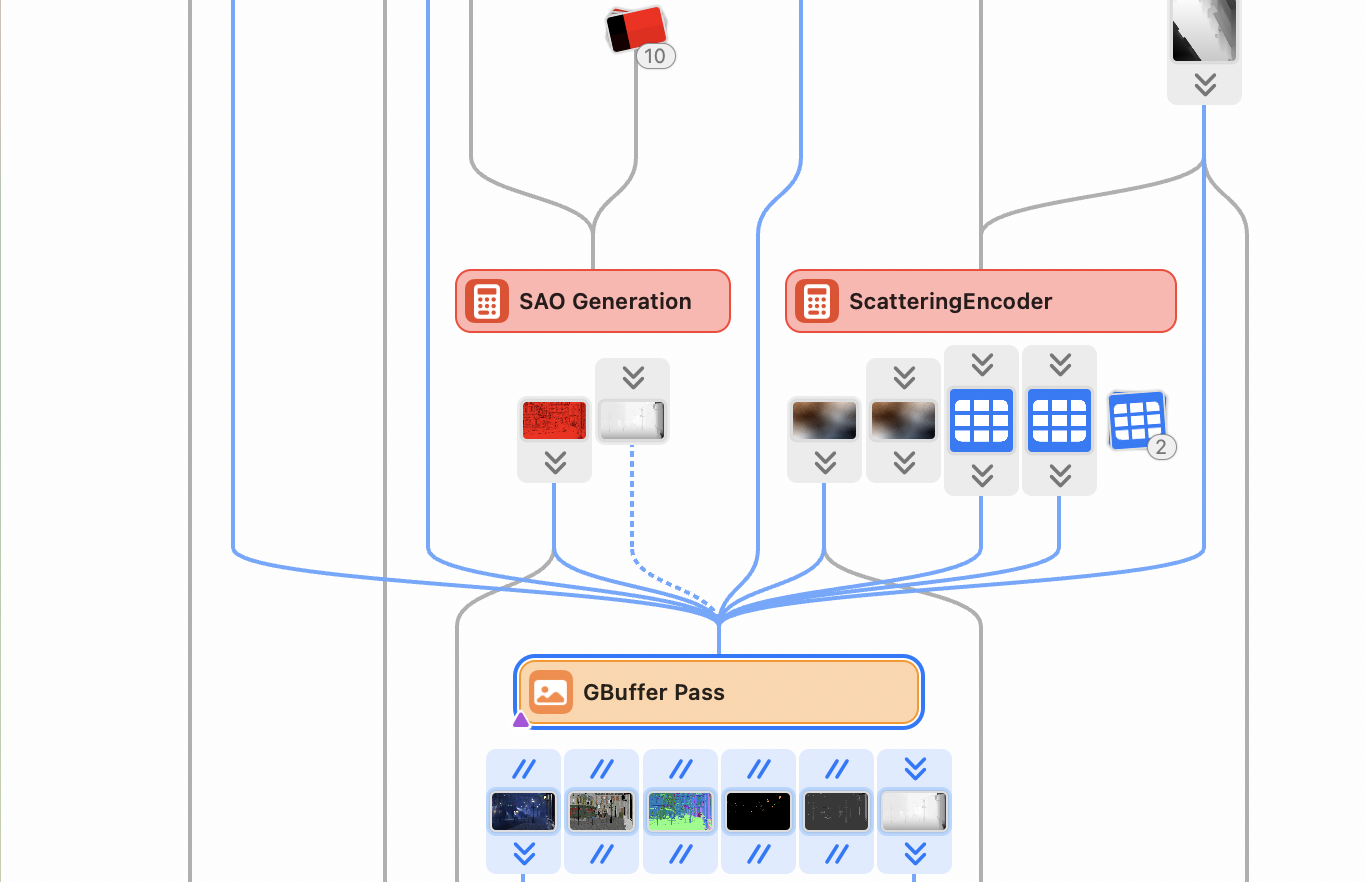
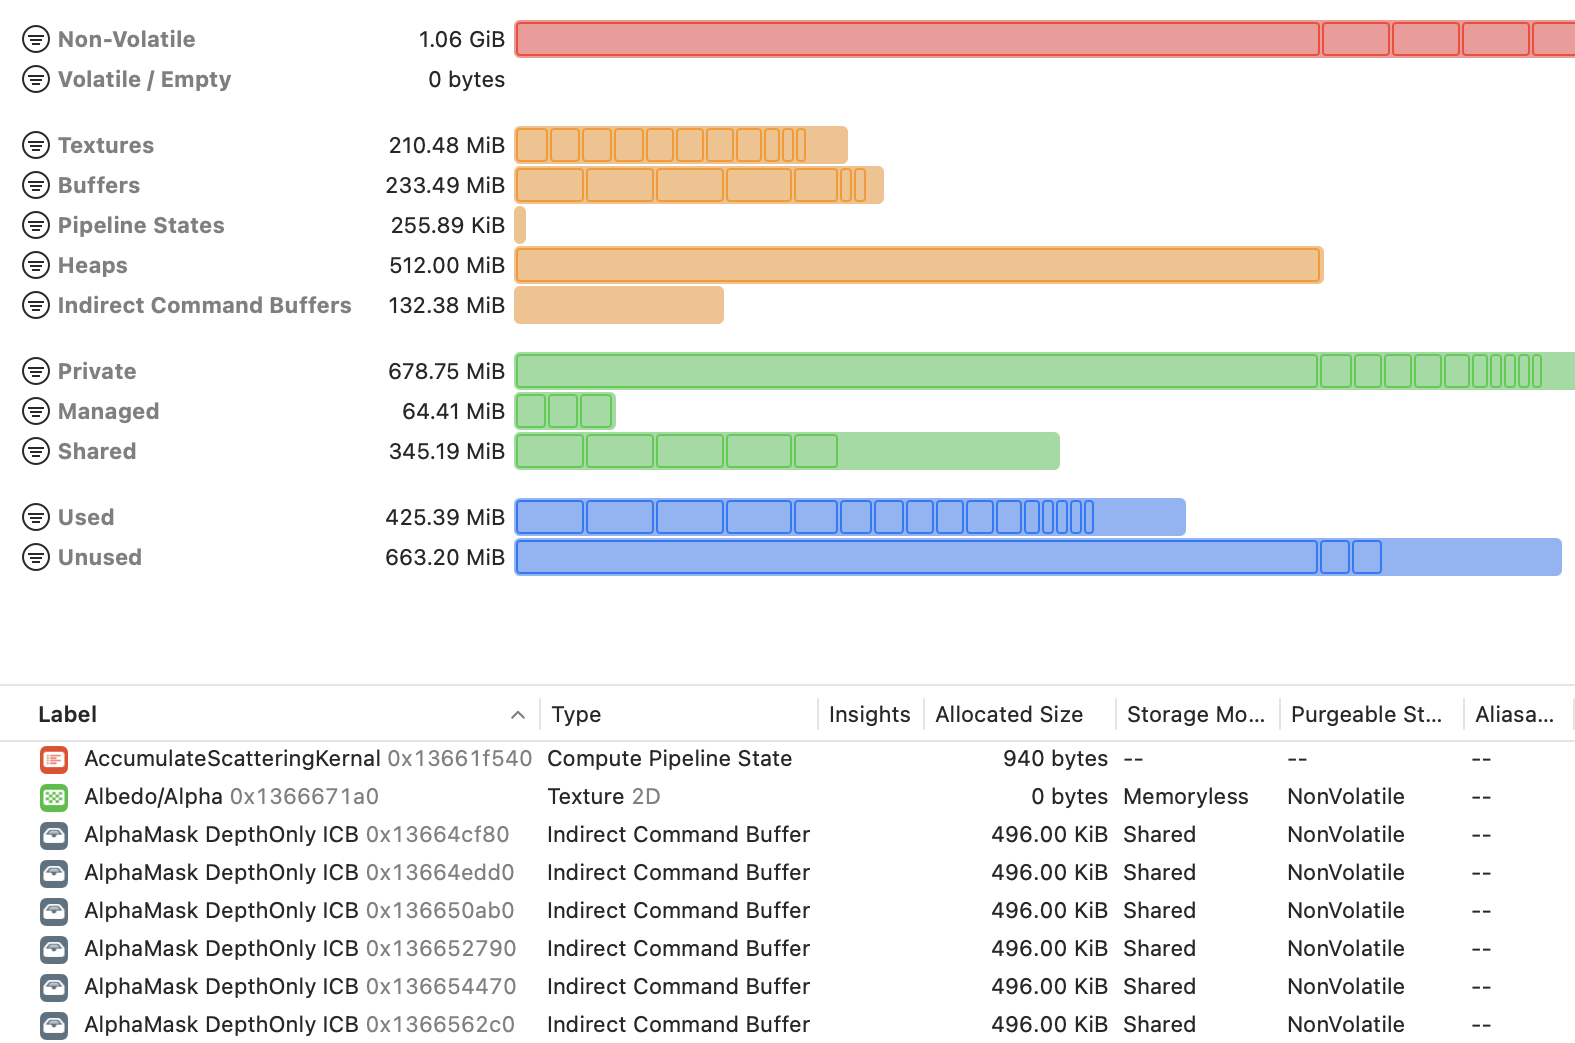
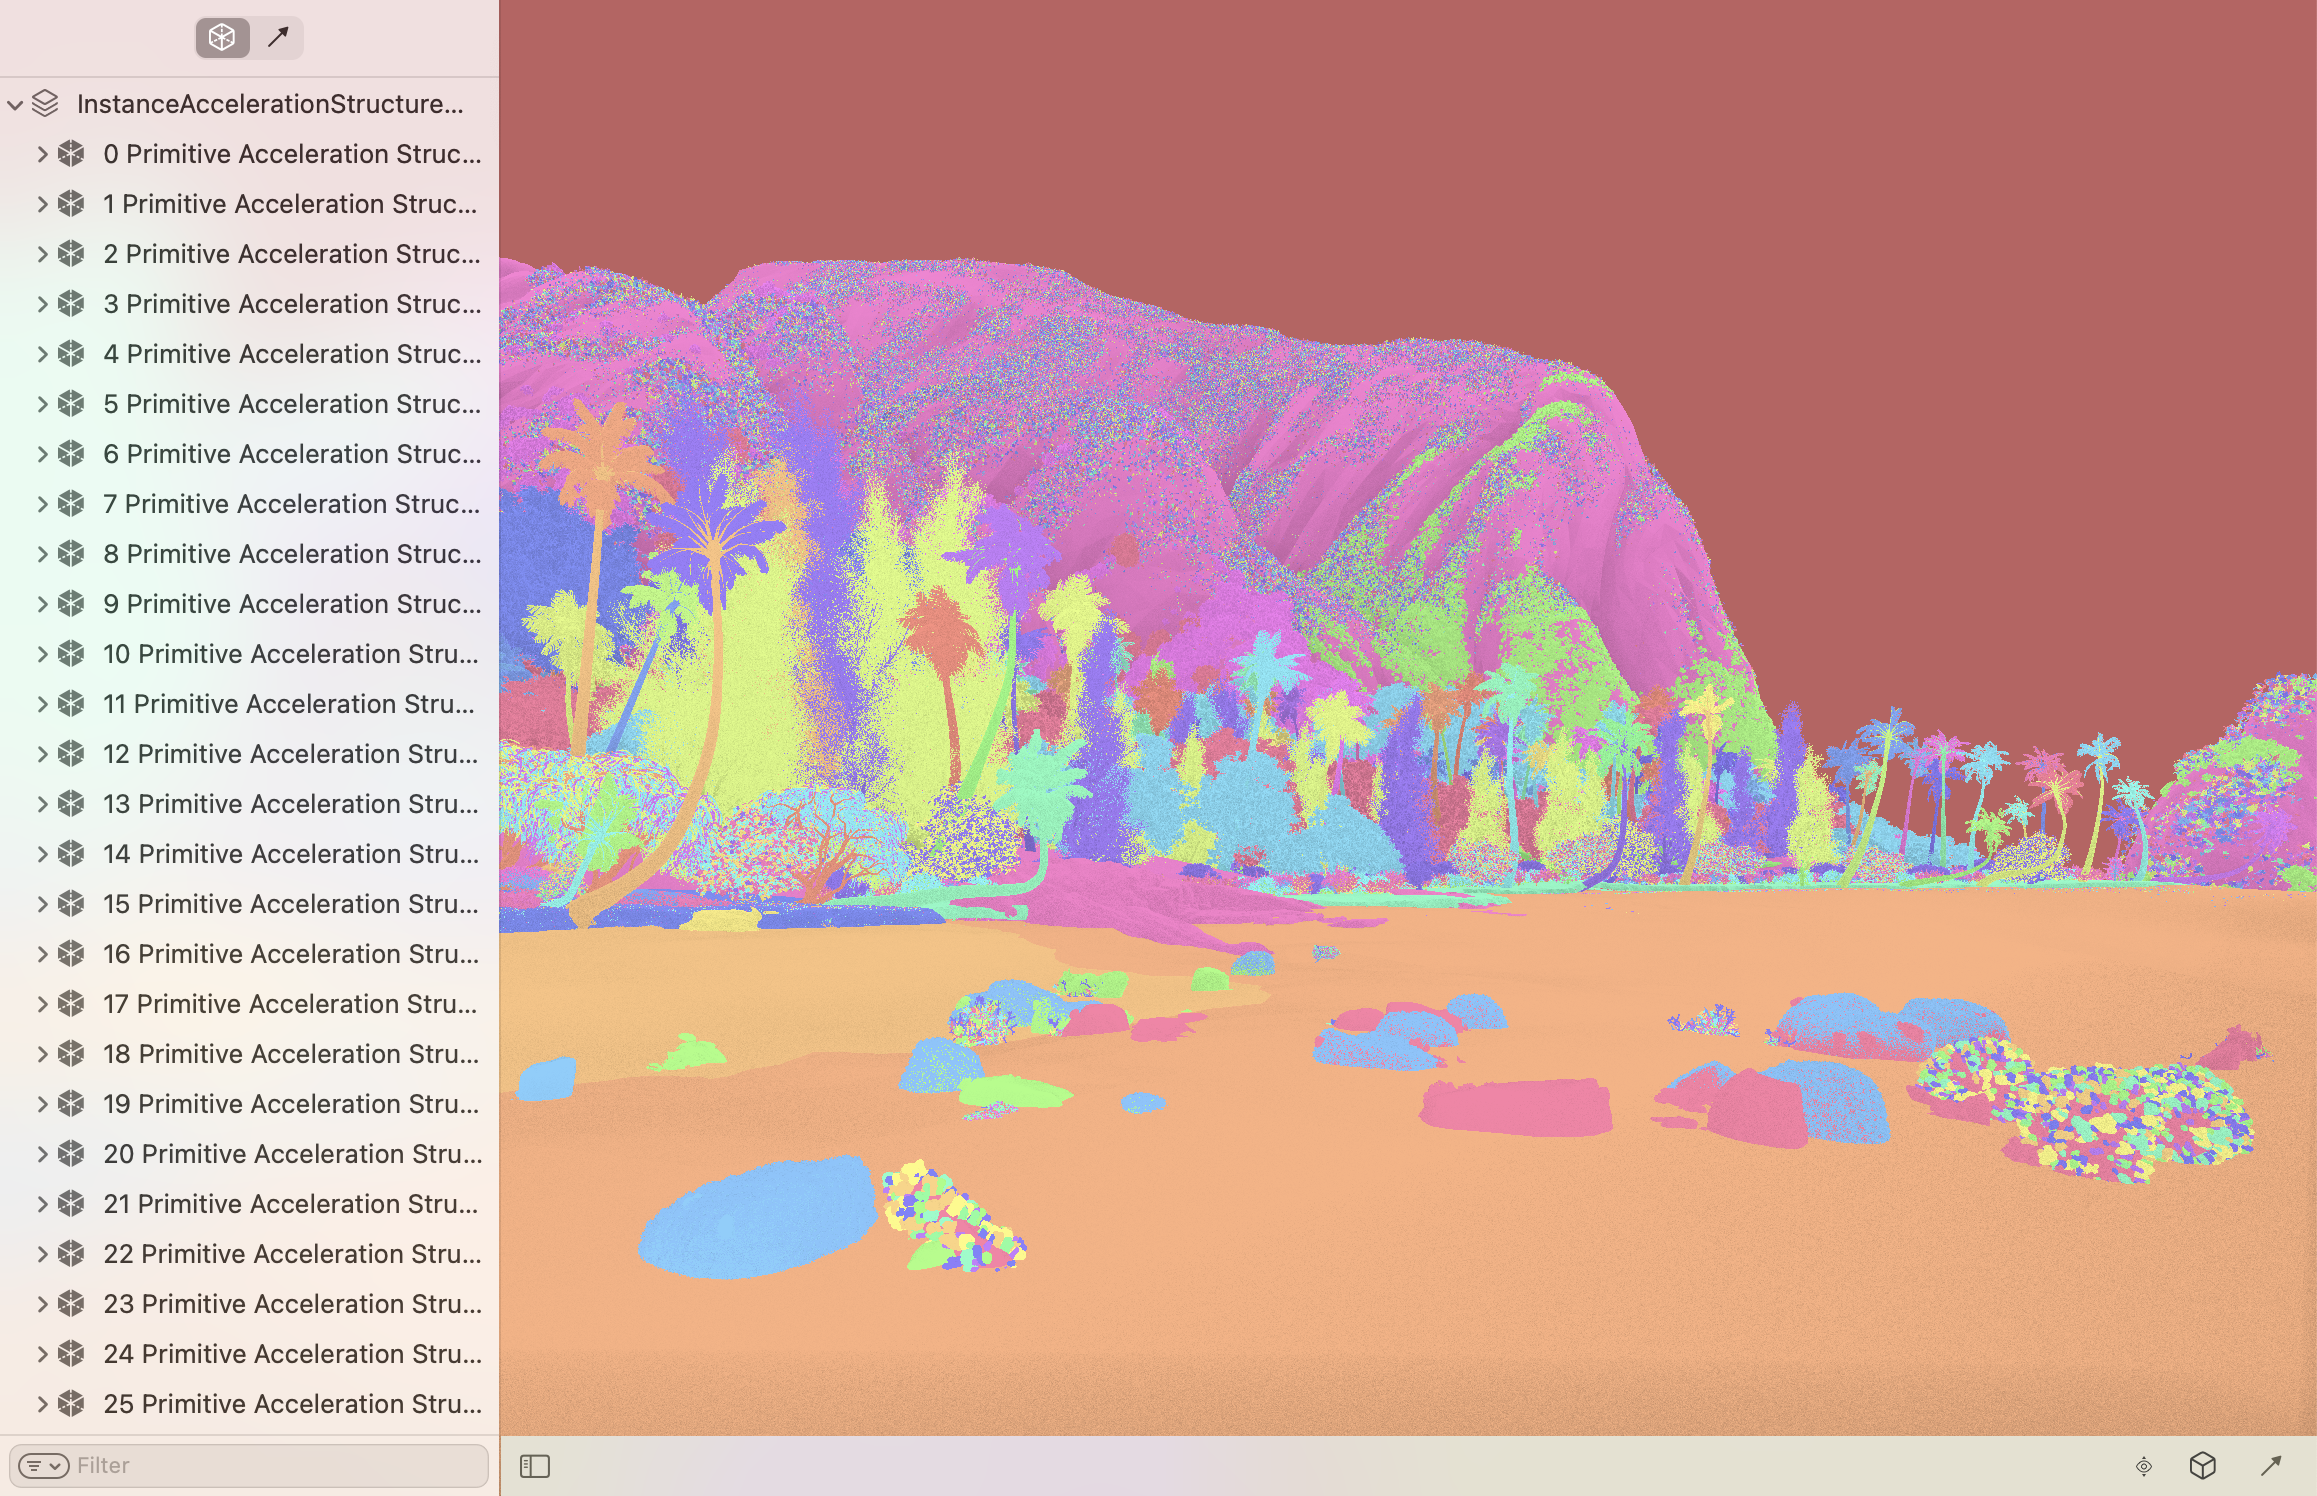
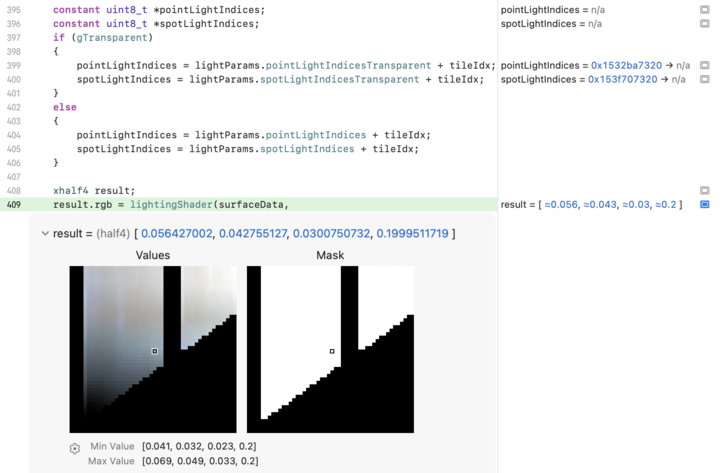
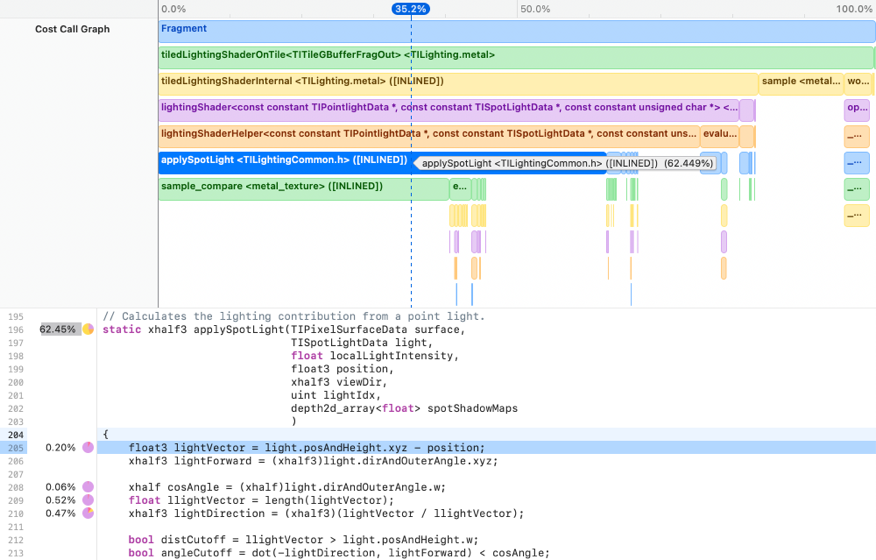
Create, debug, and profile your Metal apps with a powerful and extensive set of tools, including the Metal debugger in Xcode and Metal system trace in Instruments.

World-class debugging

Xcode comes with a comprehensive suite of advanced tools for debugging your Metal app. With the Metal debugger, you can inspect your entire rendering pipeline and all of the resources that are used. Debug and fix visual artifacts in Metal pipelines ranging from mesh shading, to ray tracing and MetalFX Upscaling.

Learn how

Scan through dependencies

The dependencies viewer provides a graphics representation of the structure of your Metal workload and allows you to view the relationships between resources and the passes which access them.

Learn more

Optimize your memory usage

The Metal debugger includes a comprehensive report of your Metal memory usage to help you optimize and reduce the memory footprint of your Metal app.

Learn more

Moana Island Scene, Copyright 2017-2022 Disney Enterprises, Inc. All rights reserved.

Inspect resources

You can inspect many resources that your Metal app uses, including objects like buffers and textures, and ray tracing acceleration structures.

Learn more

Debug your shaders

The shader debugger helps you debug issues in your shader code by jumping to any point and inspecting variable values during shader execution. Edit the shader code and reload your changes to verify the fix.

Learn more

Automatic runtime validation

Metal has a powerful built-in set of runtime diagnostic tools to help validate that your Metal app is running correctly. Xcode shows you where errors are — right inside your source code — which can help you catch bugs before they appear.

Verify your API usage

Metal can check whether you’re using the API correctly. For example, if you accidentally set the wrong flag on a texture, Metal will let you know.

Learn more

Verify your shaders

Metal can also protect your shaders from doing anything incorrectly, such as accessing a buffer out of bounds. If there’s a problem in your shader code Xcode, shows you where — right inside your shader source code.

Learn more

Take full advantage of Metal

Xcode is bundled with an advanced set of tools to help your Metal app achieve consistently smooth rendering and incredible performance on Apple hardware.

Monitor live performance

You can monitor key graphics statistics directly in your Metal app with the Metal performance HUD, making it easy to spot performance problems.

Learn more

Analyze the entire system

The Metal system trace template in Instruments provides a visual timeline of the parallel work on the CPU, GPU, and the memory usage of your Metal app.

Learn more

Improve performance with counters

The performance timeline in Xcode displays the various passes and stages running simultaneously, along with hardware counters. You can discover over-serialization by observing non-overlapping GPU work.

Learn more

Optimize your shaders

The Metal debugger includes rich performance numbers in line within your shader source, making optimizing your code a breeze. You can even edit your shaders, and reload the changes, to see how performance varies.

Learn more

Get started

Metal developer tools for macOS

Download Xcode to start using the full suite of Metal developer tools. Validate Metal API and shader usage, debug and profile your Metal app with the Metal debugger, and analyze system performance with Metal system trace in Instruments.

Learn more

Metal developer tools for Windows

Download the collection of Windows-hosted tools, headers and libraries that enable developers to build their Metal shader programs/assets for deployment on iOS, macOS, and tvOS.

Download now